Unlike Google, AI engines don't announce when they change how they pick and cite their sources. So when your brand suddenly shows up more (or less) in ChatGPT, Gemini, or another AI tool, you're left guessing: did something change on your side, or did the model itself shift in a way that affects everyone?
The AI Tracker's Volatility Dashboard (AI Volatility Score) answers that question. Every day, we ask each AI engine the same big set of questions (over 34,000 of them) and measure how much the sources it cites have changed since the day before. The result is a single volatility score per engine.
At a glance, you can see whether an engine had a calm, steady day or completely reshuffled its answers, and whether that explains why your brand went from being mentioned in half the answers to almost none.
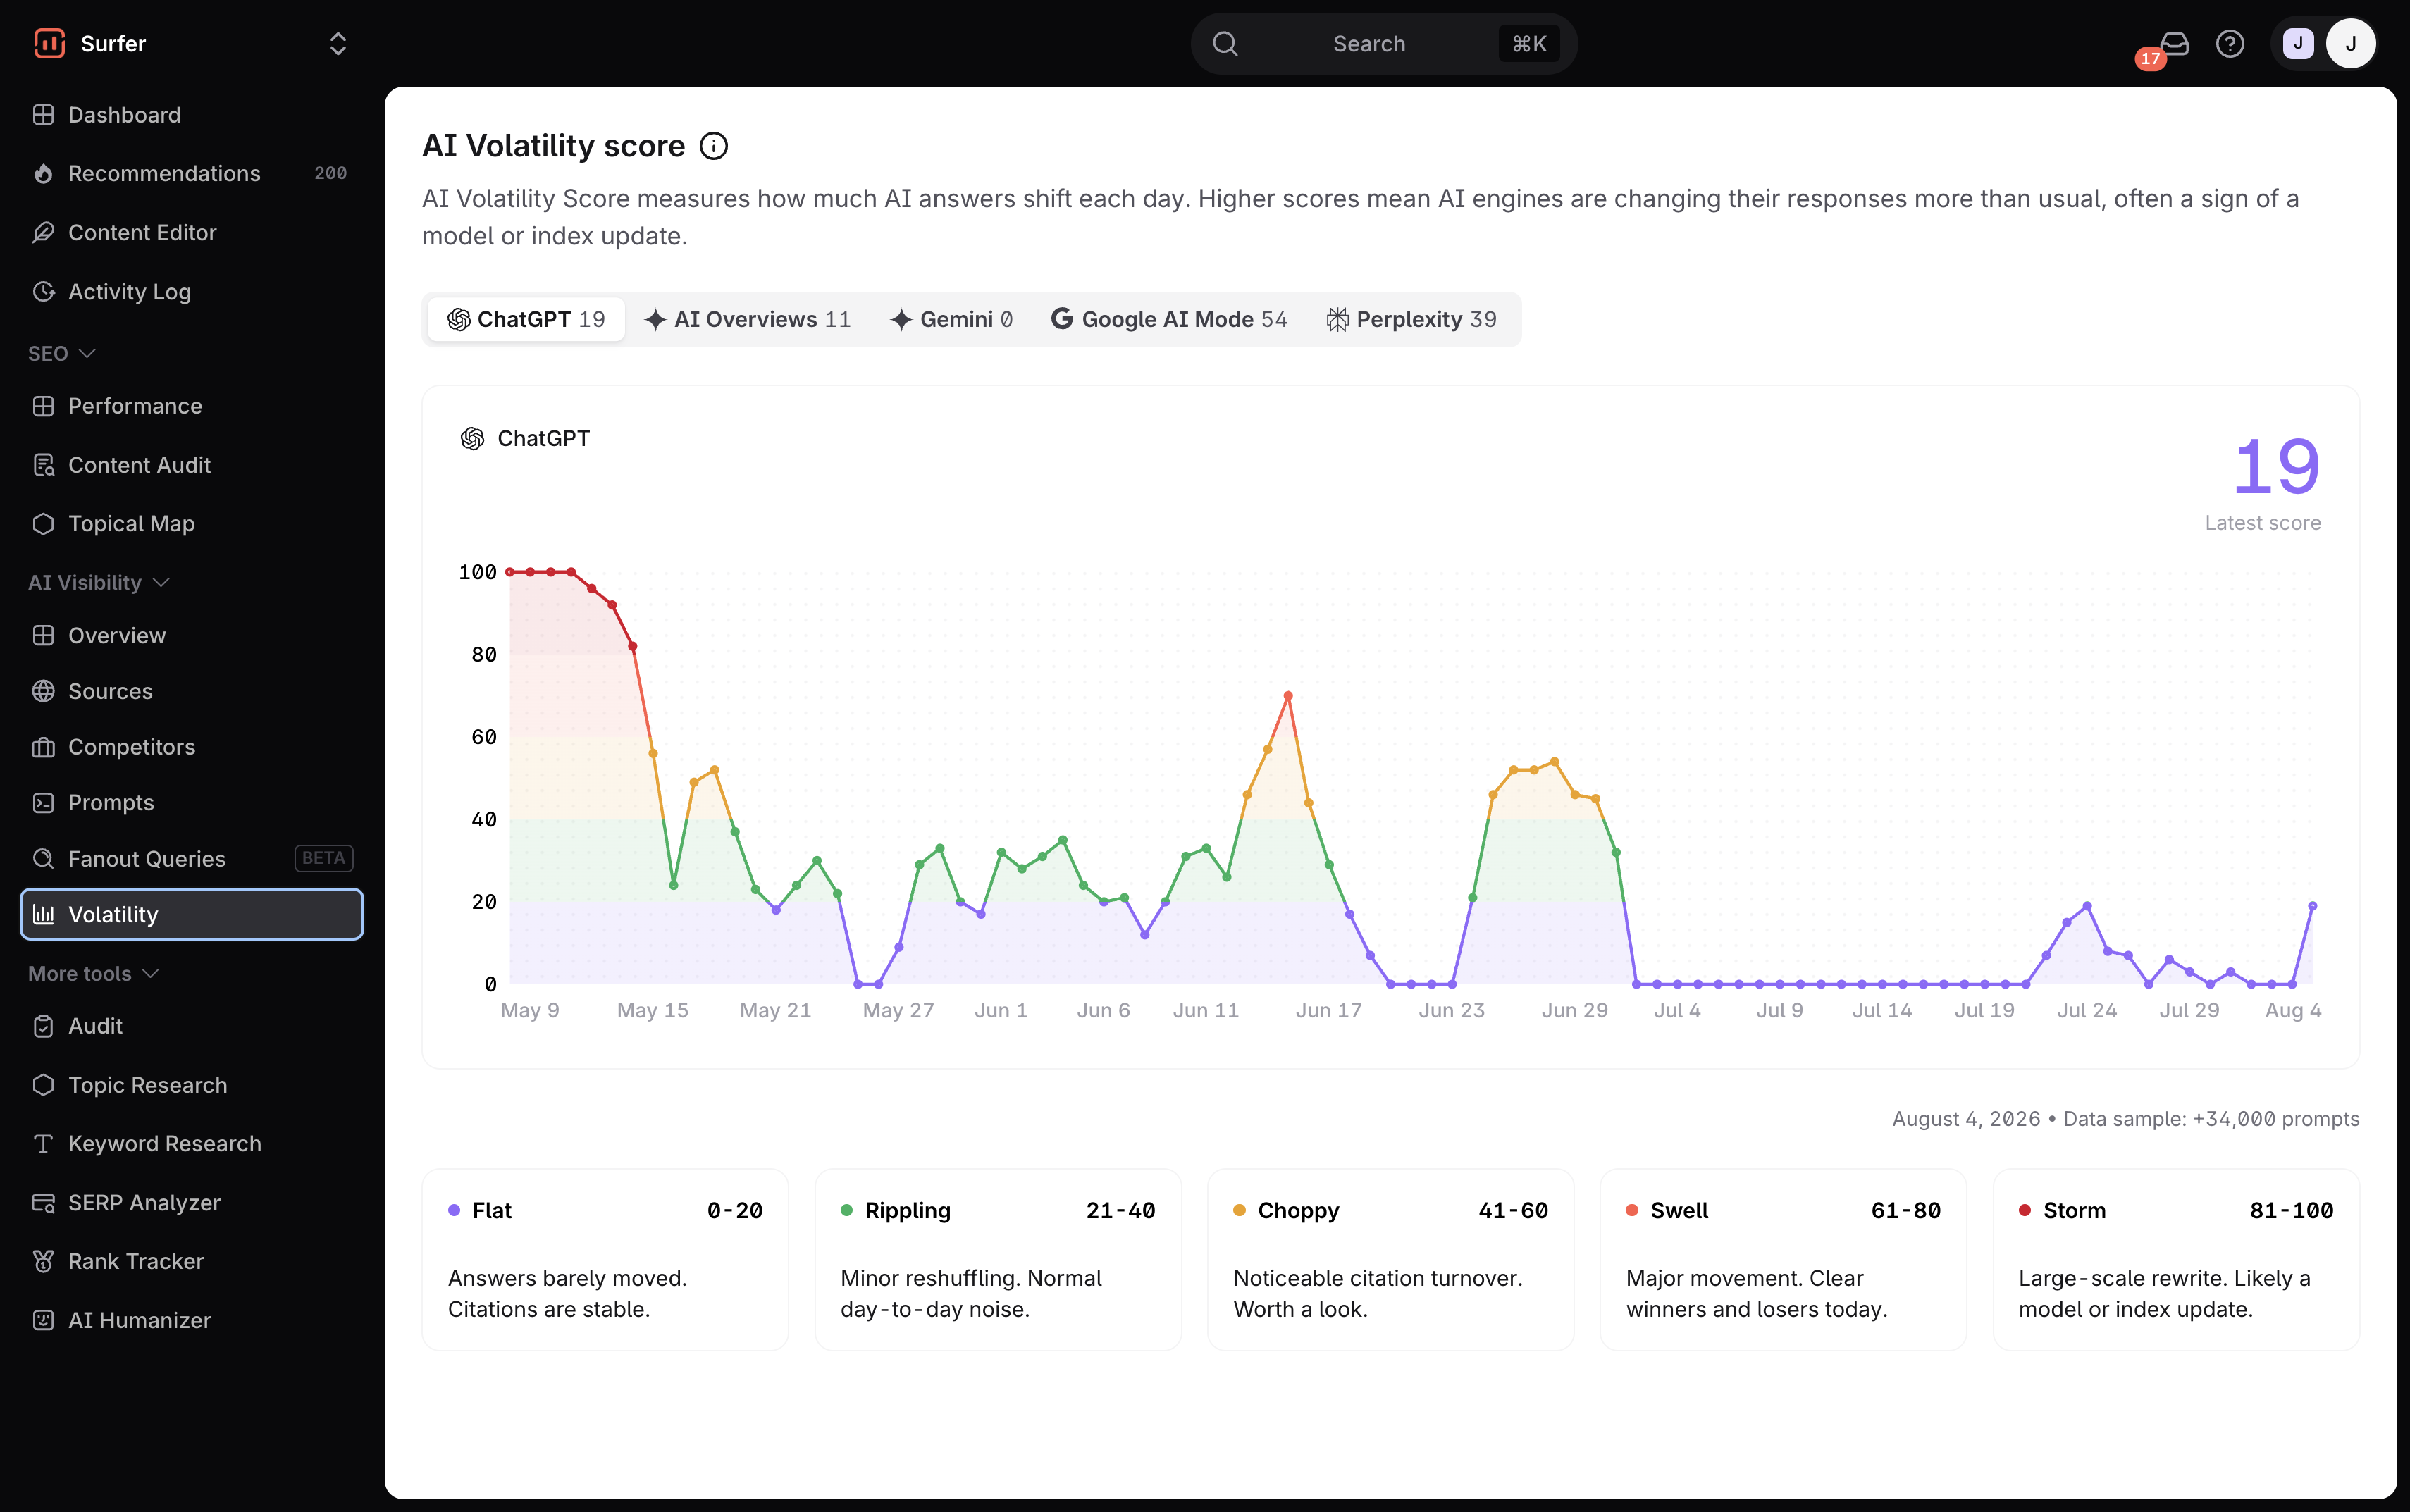
At the top of the dashboard, you’ll find a tab for each tracked AI engine: ChatGPT, AI Overviews, Gemini, Google AI Mode, and Perplexity. Each tab shows that engine’s latest score right next to its name, so you can scan them all before drilling into one.
Volatility is calculated separately per engine, because each one updates on its own schedule and behaves differently. A quiet week on ChatGPT doesn’t tell you anything about what Gemini or AI Mode were doing. Always check the engine you actually care about.
Unlike the Overview, Sources, and Competitors dashboards, there’s no date-range filter here. The graph always shows you the available history for that engine at a glance.
Selecting a model tab loads that engine’s graph. A color-coded line chart plots the daily score over time, with the current Latest score displayed alongside it. The line’s color shifts along with the score band it’s in (see the scale below), so spikes and calm stretches are easy to spot.
Hover over any point on the line to see related date, band (e.g., Flat, Choppy), and its exact score.
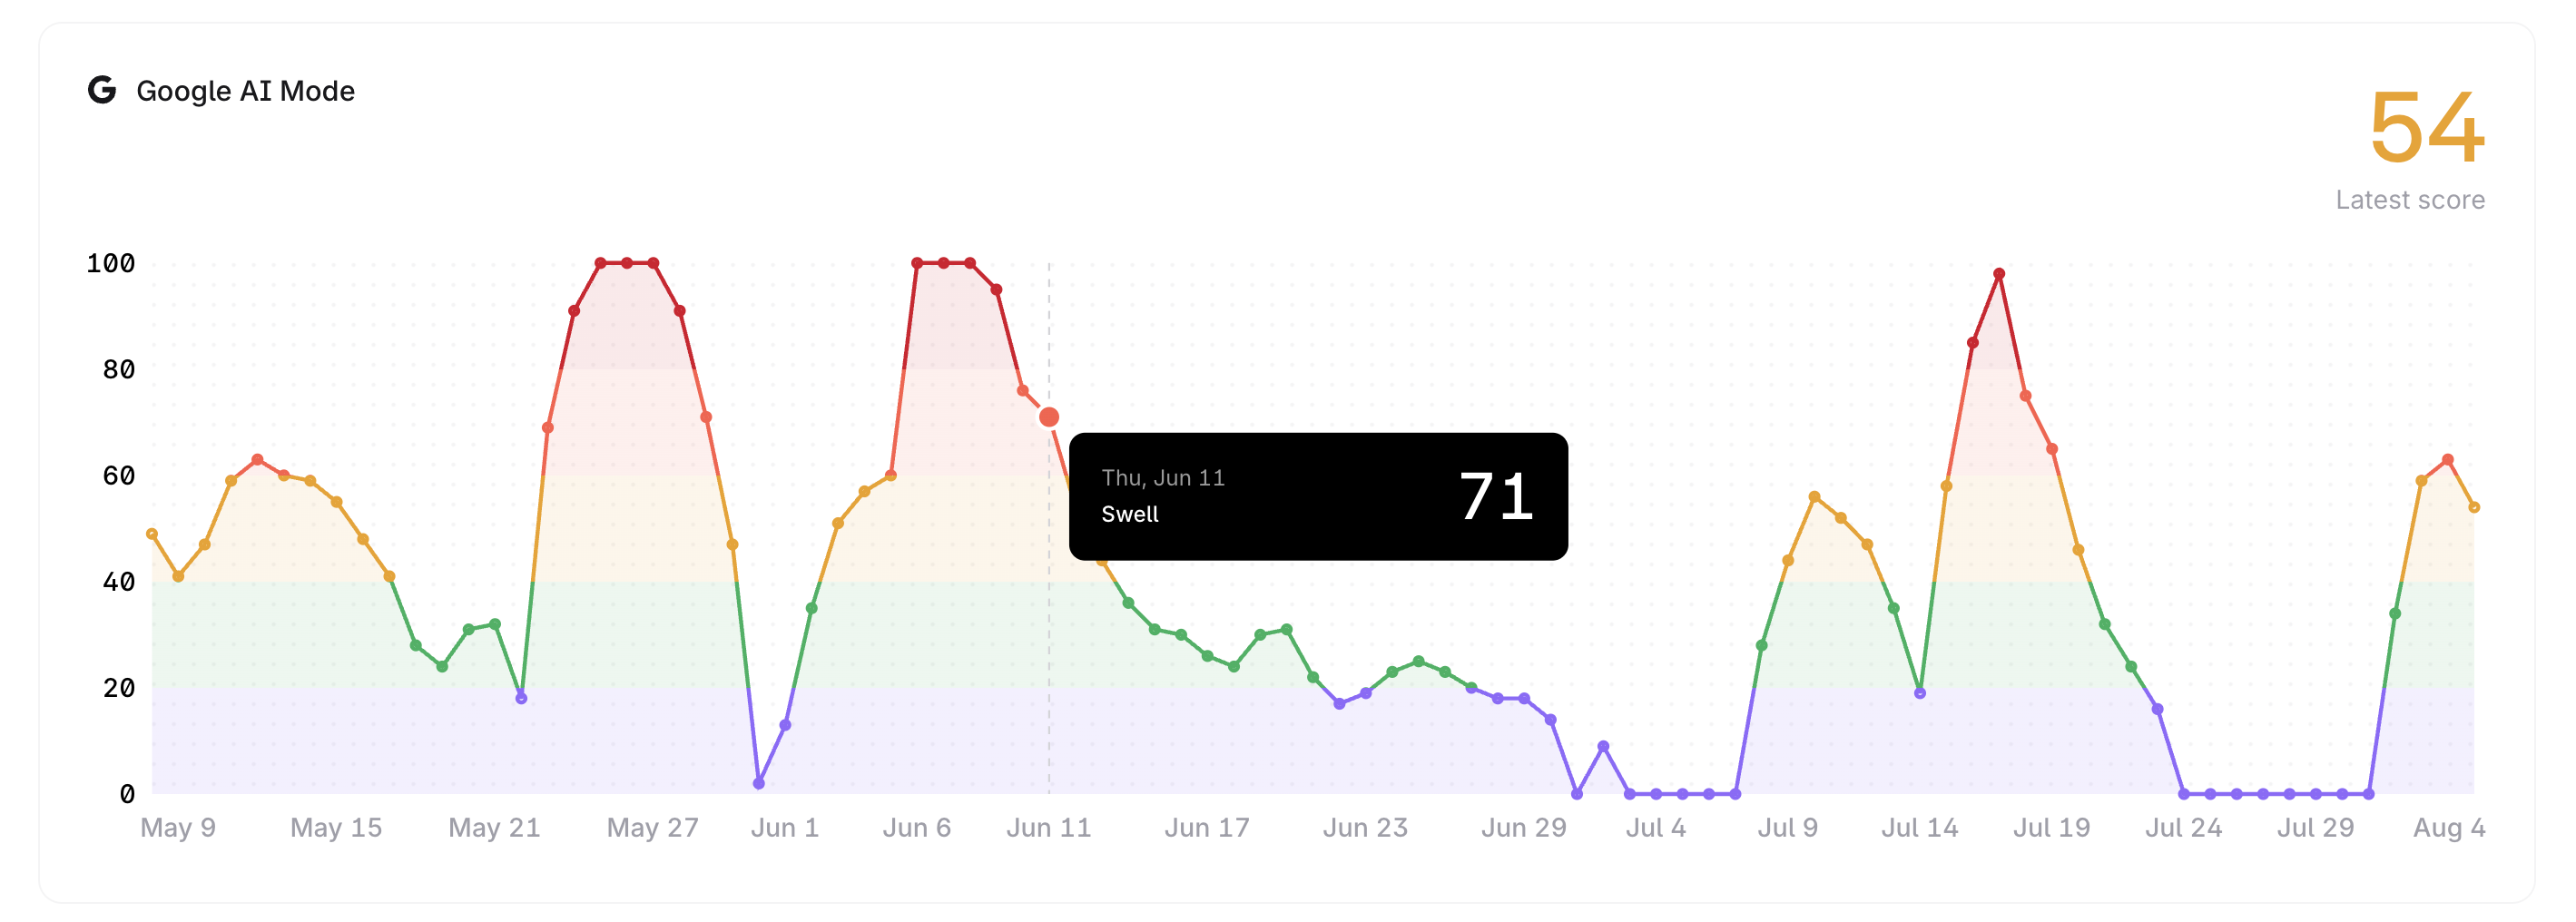
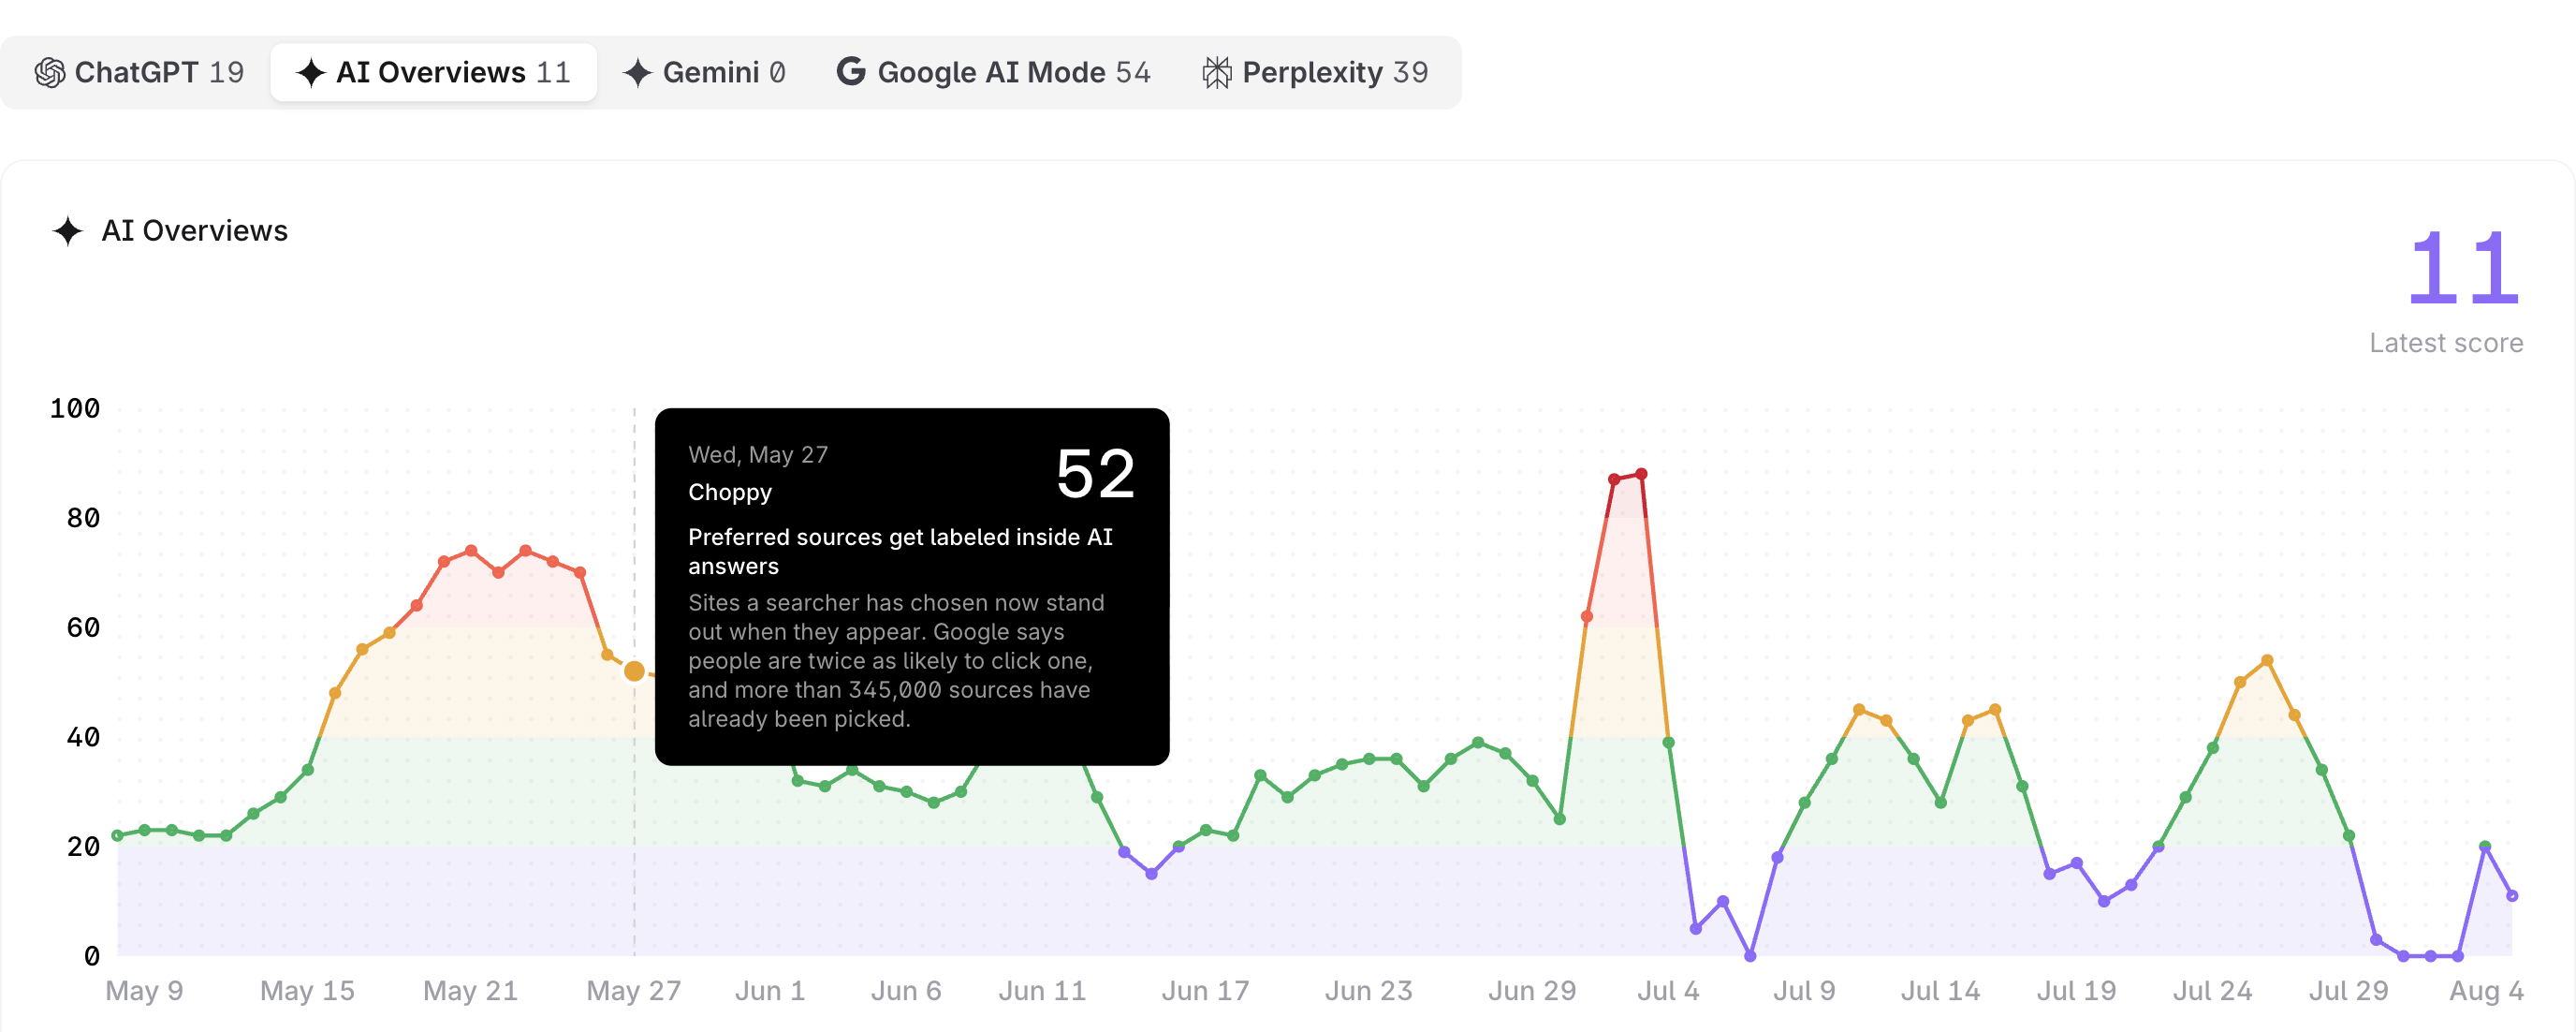
When a spike lines up with a known, significant change, hovering over that day also shows a short note explaining what happened. See the example below:
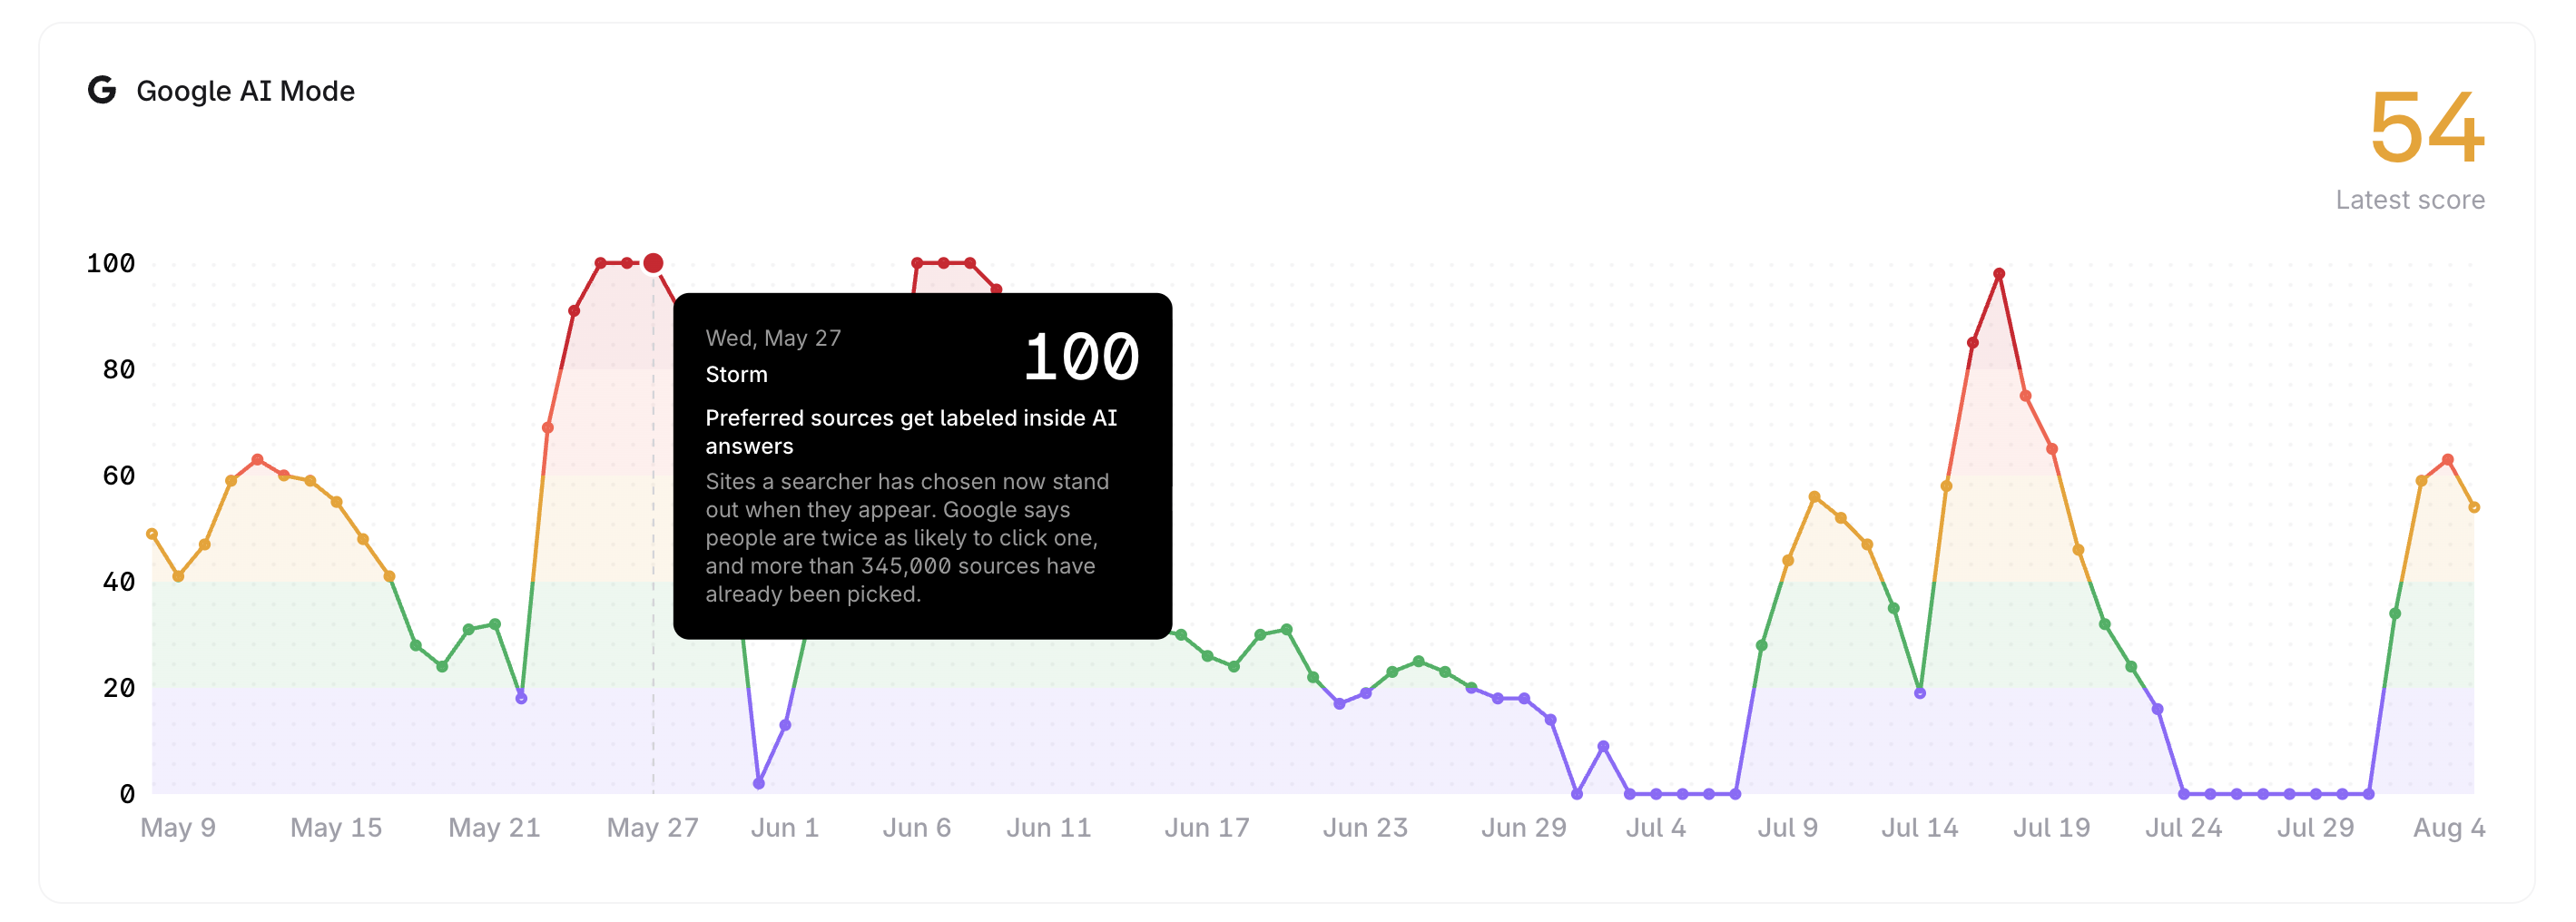
A day without a note simply reflects normal day-to-day fluctuation (or the lack of it) for that engine.
Navigate to AI Visibility on the left menu panel and select Volatility
Select the tab of the engine you want to check and track: ChatGPT, AI Overviews, Gemini, Google AI Mode, or Perplexity

Check the Latest score and where it falls on the Flat-to-Storm scale to see how much that engine's answers shifted on its most recent day
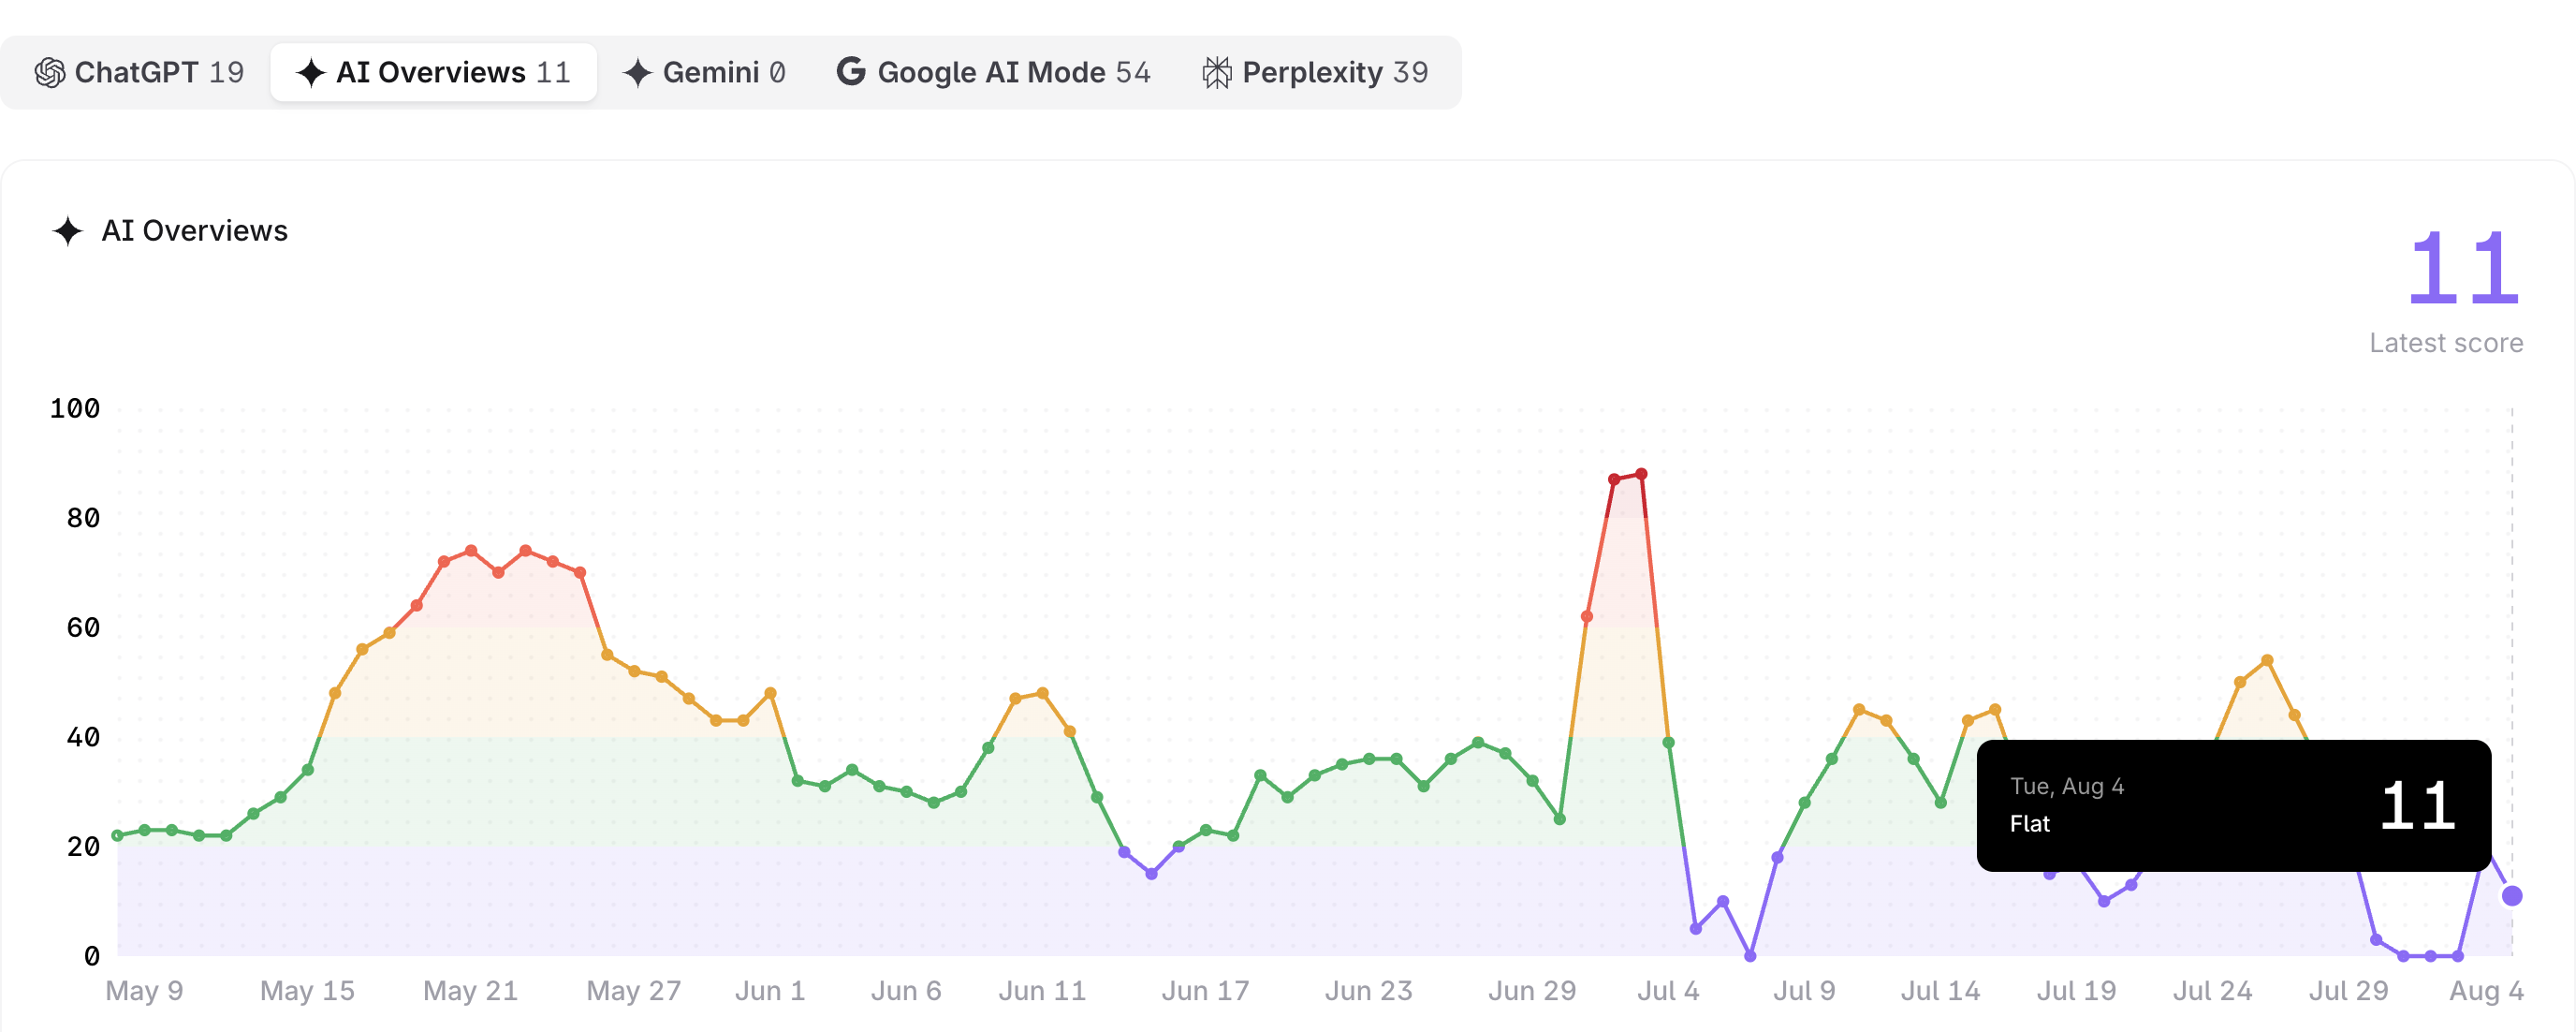
Hover over points on the graph to review specific days, and look for model-change event notes on days with a documented rollout or update
If you’re trying to explain a shift in your own reports (for example, fewer views in comparison to a previous month), check the same date and engine on your Overview or Competitors dashboard to see whether the reshuffle helped or hurt your brand.
The most recent 24-hour volatility reading for the selected engine, shown as a single number from 0-100
Every score falls into one of five bands:
Flat (0–20): The engine's answers held steady. The previous day citations are still showing up today.
Rippling (21–40): A bit of reshuffling, normal day-to-day variation.
Choppy (41–60): Citations are turning over more than usual, worth a quick look at what changed.
Swell (61–80): A significant shake-up, with clear gainers and losers in today's answers.
Storm (81–100): A near-total rewrite of citations, usually the fingerprint of a model or index update.

A high score isn’t automatically bad news for you. It just means the engine reshuffled its citations broadly. Pair it with your own AI Tracker numbers (Overview and Competitors) to see whether that reshuffle helped or hurt your visibility.
Each score is based on a representative sample of +34k prompts run against that engine, refreshed daily. Sampling this many prompts, rather than just your tracked ones, lets us measure genuine model/index-level change, separate from the normal randomness (“nondeterminism”) built into how LLMs generate answers.
If your visibility score, mention rate, or average position drops on the Overview Dashboard, you can check the Volatility Dashboard for that same engine data. If it shows an elevated Volatility Score (Choppy or higher) on the same day, the shift is likely tied to a broader change on the engine’s side rather than your content strategy.
If the engine was Flat that day, the drop is more likely due to your own content or prompt strategy.
Because each engine is scored separately, you can spot whether a change is confined to one model or industry-wide.
Which AI engines does the Volatility Dashboard track?
ChatGPT, Google AI Overviews, Gemini, Google AI Mode, and Perplexity. Each on its own tab, with its own score.
How often does the score update?
Daily. Each engine’s sample is re-run every day, so the score you see reflects the most recent full day of citation movement.
Is the score based on my own tracked prompts?
No. It’s based on a broad representative sample of +34k prompts per engine. Independent of the specific prompts in your AI Tracker project.
Does a high volatility score mean I lost visibility?
Not on its own. It means the engine reshuffled its citations broadly that day, for better or worse. Check your Overview or Competitors dashboards for the same day to see whether the reshuffle actually helped or hurt your brand.
Do I need a paid Surfer subscription to see volatility scores?
Not entirely. The full dashboard of all five AI engines inside your AI Tracker project is available to paid Surfer subscribers. If you don’t have a paid subscription, you can still check daily volatility for free using the Freemium Surfer Pulse. The free version shows ChatGPT and Google AI Overviews. Gemini, Google AI Mode, and Perplexity require a paid Surfer account.
What are the notes that pop up when I hover over a point on the graph?
Those are model-change events. Short callouts on days tied to known, documented changes (i.e., a model rollout, feature launch, market expansion, etc.). Not every day displays one. A point without a note just reflects normal movement for that engine.
What do the Flat/Rippling/Choppy/Swell/Storm labels mean?
These are the five bands the 0-100 score falls into, from most stable (Flat, 0-20) to most disrupted (Storm, 81-100). See the Key Metrics section above for the full breakdown.
