The AI Tracker Overview Dashboard is your go-to place to keep an eye on how your brand appears across different AI models. From here, you can monitor visibility, track mentions, and compare positions across the models that matter most to your business.
On top of the dashboard, you’ll find a date range dropdown filter. Use it to set the timeframe you’d like to analyze. After choosing a range, all graphs and numbers below will instantly update to reflect the analysis for that period.

Next to the date selector is the model filter. By default, it shows results from All models, but you can also zero in on a specific one. Options include popular AI systems such as:
ChatGPT
Gemini
Perplexity
AI Mode
AI Overviews
And more in the future!
This makes it easy to either zoom in on a single model or keep the big-picture view. Just like selecting your timeline, choosing the model will update the graph instantly.
You can go beyond tracking your own brand and see how you are performing against competitors using the same prompts.
This helps with:
Benchmarking visibility, mention rate, and positions directly against other brands,
Spotting gaps where competitors are outperforming you, and
Identifying strengths where you already lead.
Select the Compare button right beside your filter controls, choose a competitor to do a side-by-side comparison of key metrics, and use these insights to refine your content, targeting, and prompt strategy.

The overview highlights three main metrics: visibility score, mention rate, and average position. Each one comes with its own graph for a deeper look:
Shows how often and how prominently your brand appears in AI answers. A higher score means your brand is consistently appearing in prominent spots. From your Overview Dashboard, you can view your visibility score as a line or bar graph.
This shows how often your brand is mentioned across AI models. It’s a simple way to see the scale of your brand’s presence, regardless of where it appears.
This tells you the typical ranking of your brand when it’s mentioned. The closer the number is to 1, the earlier (and more prominently) your brand tends to appear.

Below the Visibility Score graph, you’ll find the Topics & Prompts and Sources sections.
Your Topics & Prompts overview provides a quick glance at the most common AI instructions triggered by your tracked prompts, along with their visibility scores. It helps you instantly see which user queries perform best, without leaving the dashboard.
By default, you will be on the >_ tab which lists the visibility score for each prompt. Select # tab if you want to see the average visibility score.
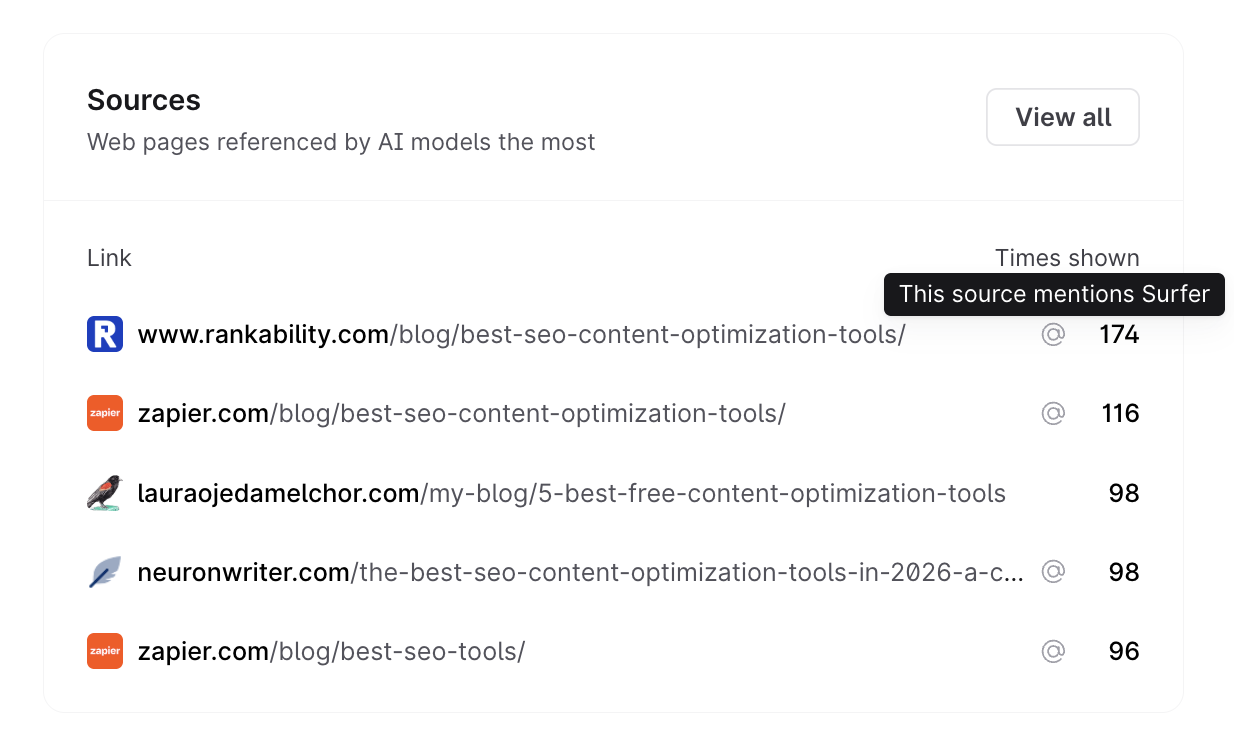
As for the Sources overview, these are the web pages that AI models reference most. This gives you a smart preview of the sources most often cited when AI models mention your brand, along with how many times the URL was shown in LLM responses.
Trends are available across the AI Tracker, including the Overview, Sources, Competitors, Prompts, and Fanout Queries dashboards. They let you seamlessly compare performance across time periods.
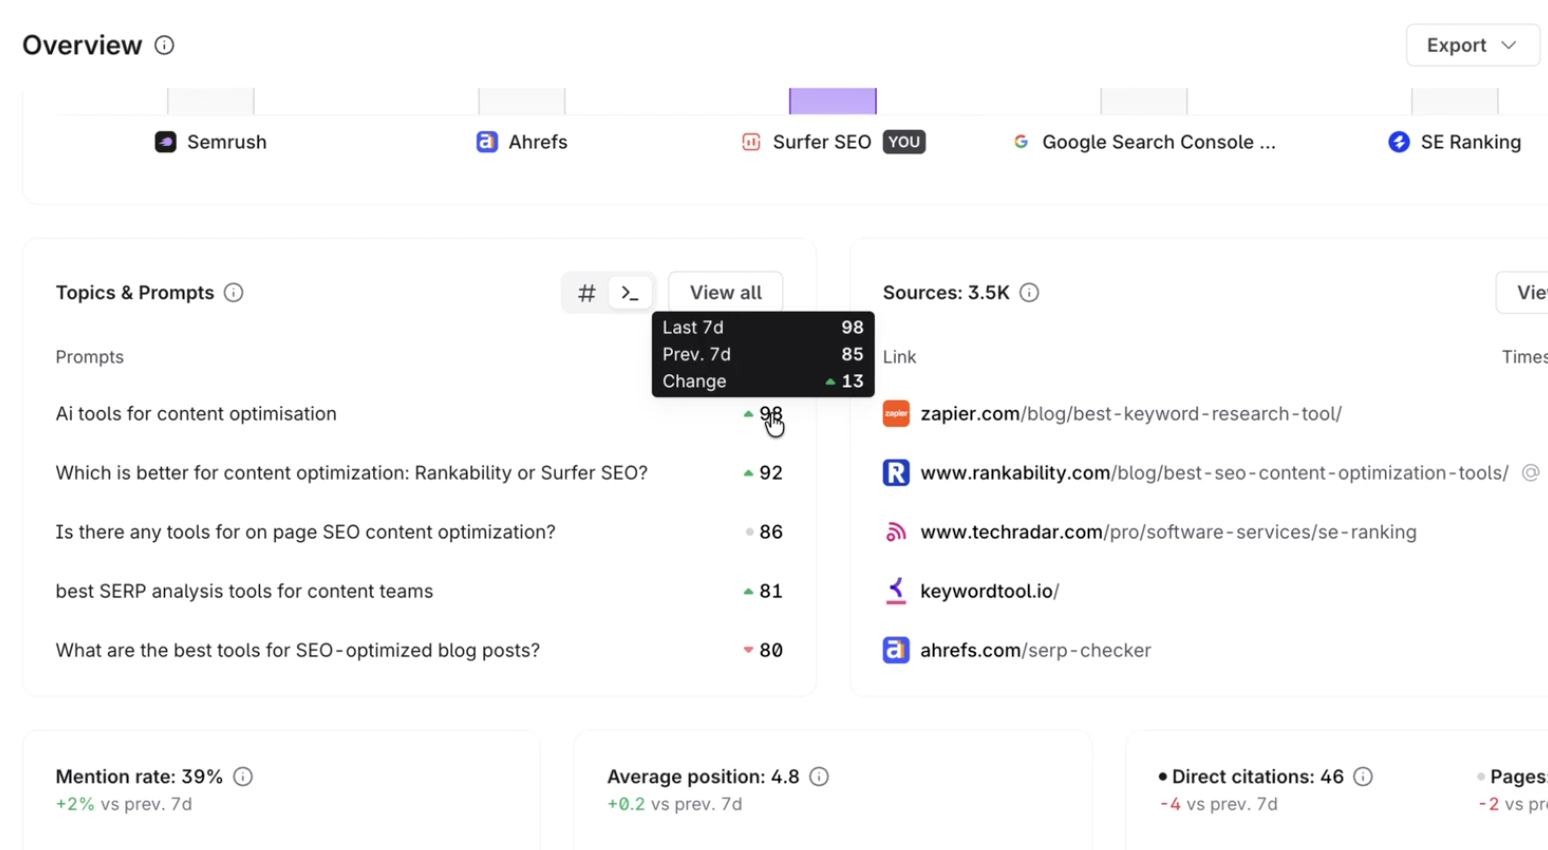
Trends compare your currently selected period against the equivalent previous period, for example, the current 7 days vs. the 7 days before that.
An upward trend indicates improvement; a downward trend signals a decline.

From your AI Tracker’s Overview Dashboard, you have an option to view three more major reports:
If you’d like to view your competitors in detail, you can find the “View Competitors” button in the visibility score section.

If you'd like to revise some of your prompts, you can always do so by clicking the View all button from the Topics & Prompts section, which redirects you to the Prompts Dashboard.
You can also select “View all” from the Sources section to open the full AI Tracker Sources Dashboard, where you can explore every reference in detail.

You can download the analysis as a .CSV format by clicking the Export button found on the top right corner of the dashboard.
Additionally, you can share view-only access to your AI Tracker report. Perfect for sharing wins with your team or clients to keep them updated on your visibility progress.