The AI Tracker’s Prompt Management Dashboard is your centralized place to view, organize, and analyze all of your AI prompt usage. It helps you understand how your brand appears in AI‑generated content, and gives full access to review and manage the prompts you’re using.
Here's a quick step-by-step walkthrough on how you can create your prompts with AI Tracker:
Select AI Tracker from the left panel on your dashboard
From the AI Tracker page, type your brand name in the input field and then select the Enter button
Type the topic or keyword you want to monitor in the text field and then choose ‘Next’ to proceed to the next step
Select your target location and language
Review the list of prompts.
If your prompt limits allow, you have the option to either add a single prompt or add bulk prompts
You can also untick the checkbox if you want to remove a prompt. You will also have the option to restore a prompt.
Select ‘Finish’ to complete the setup process.

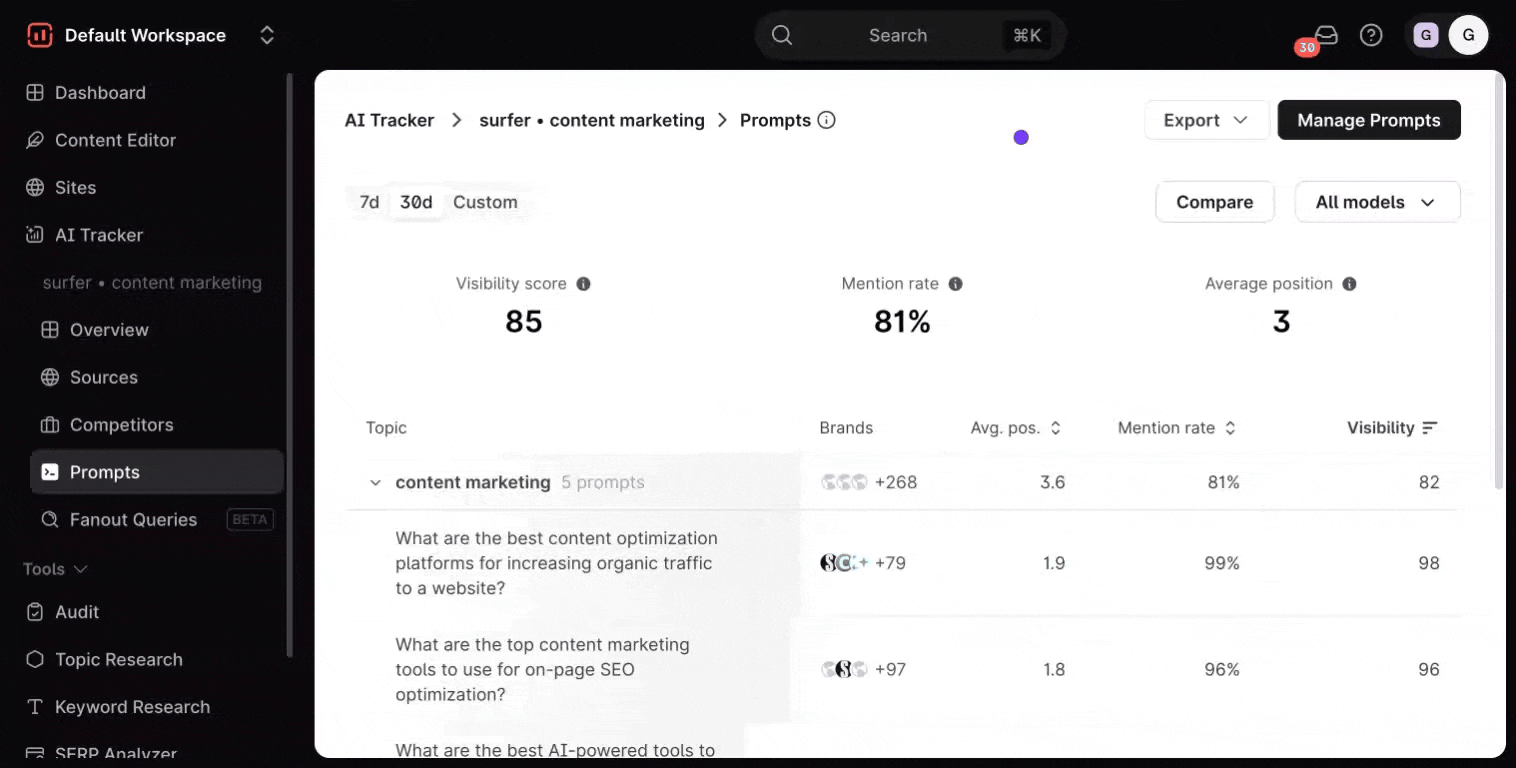
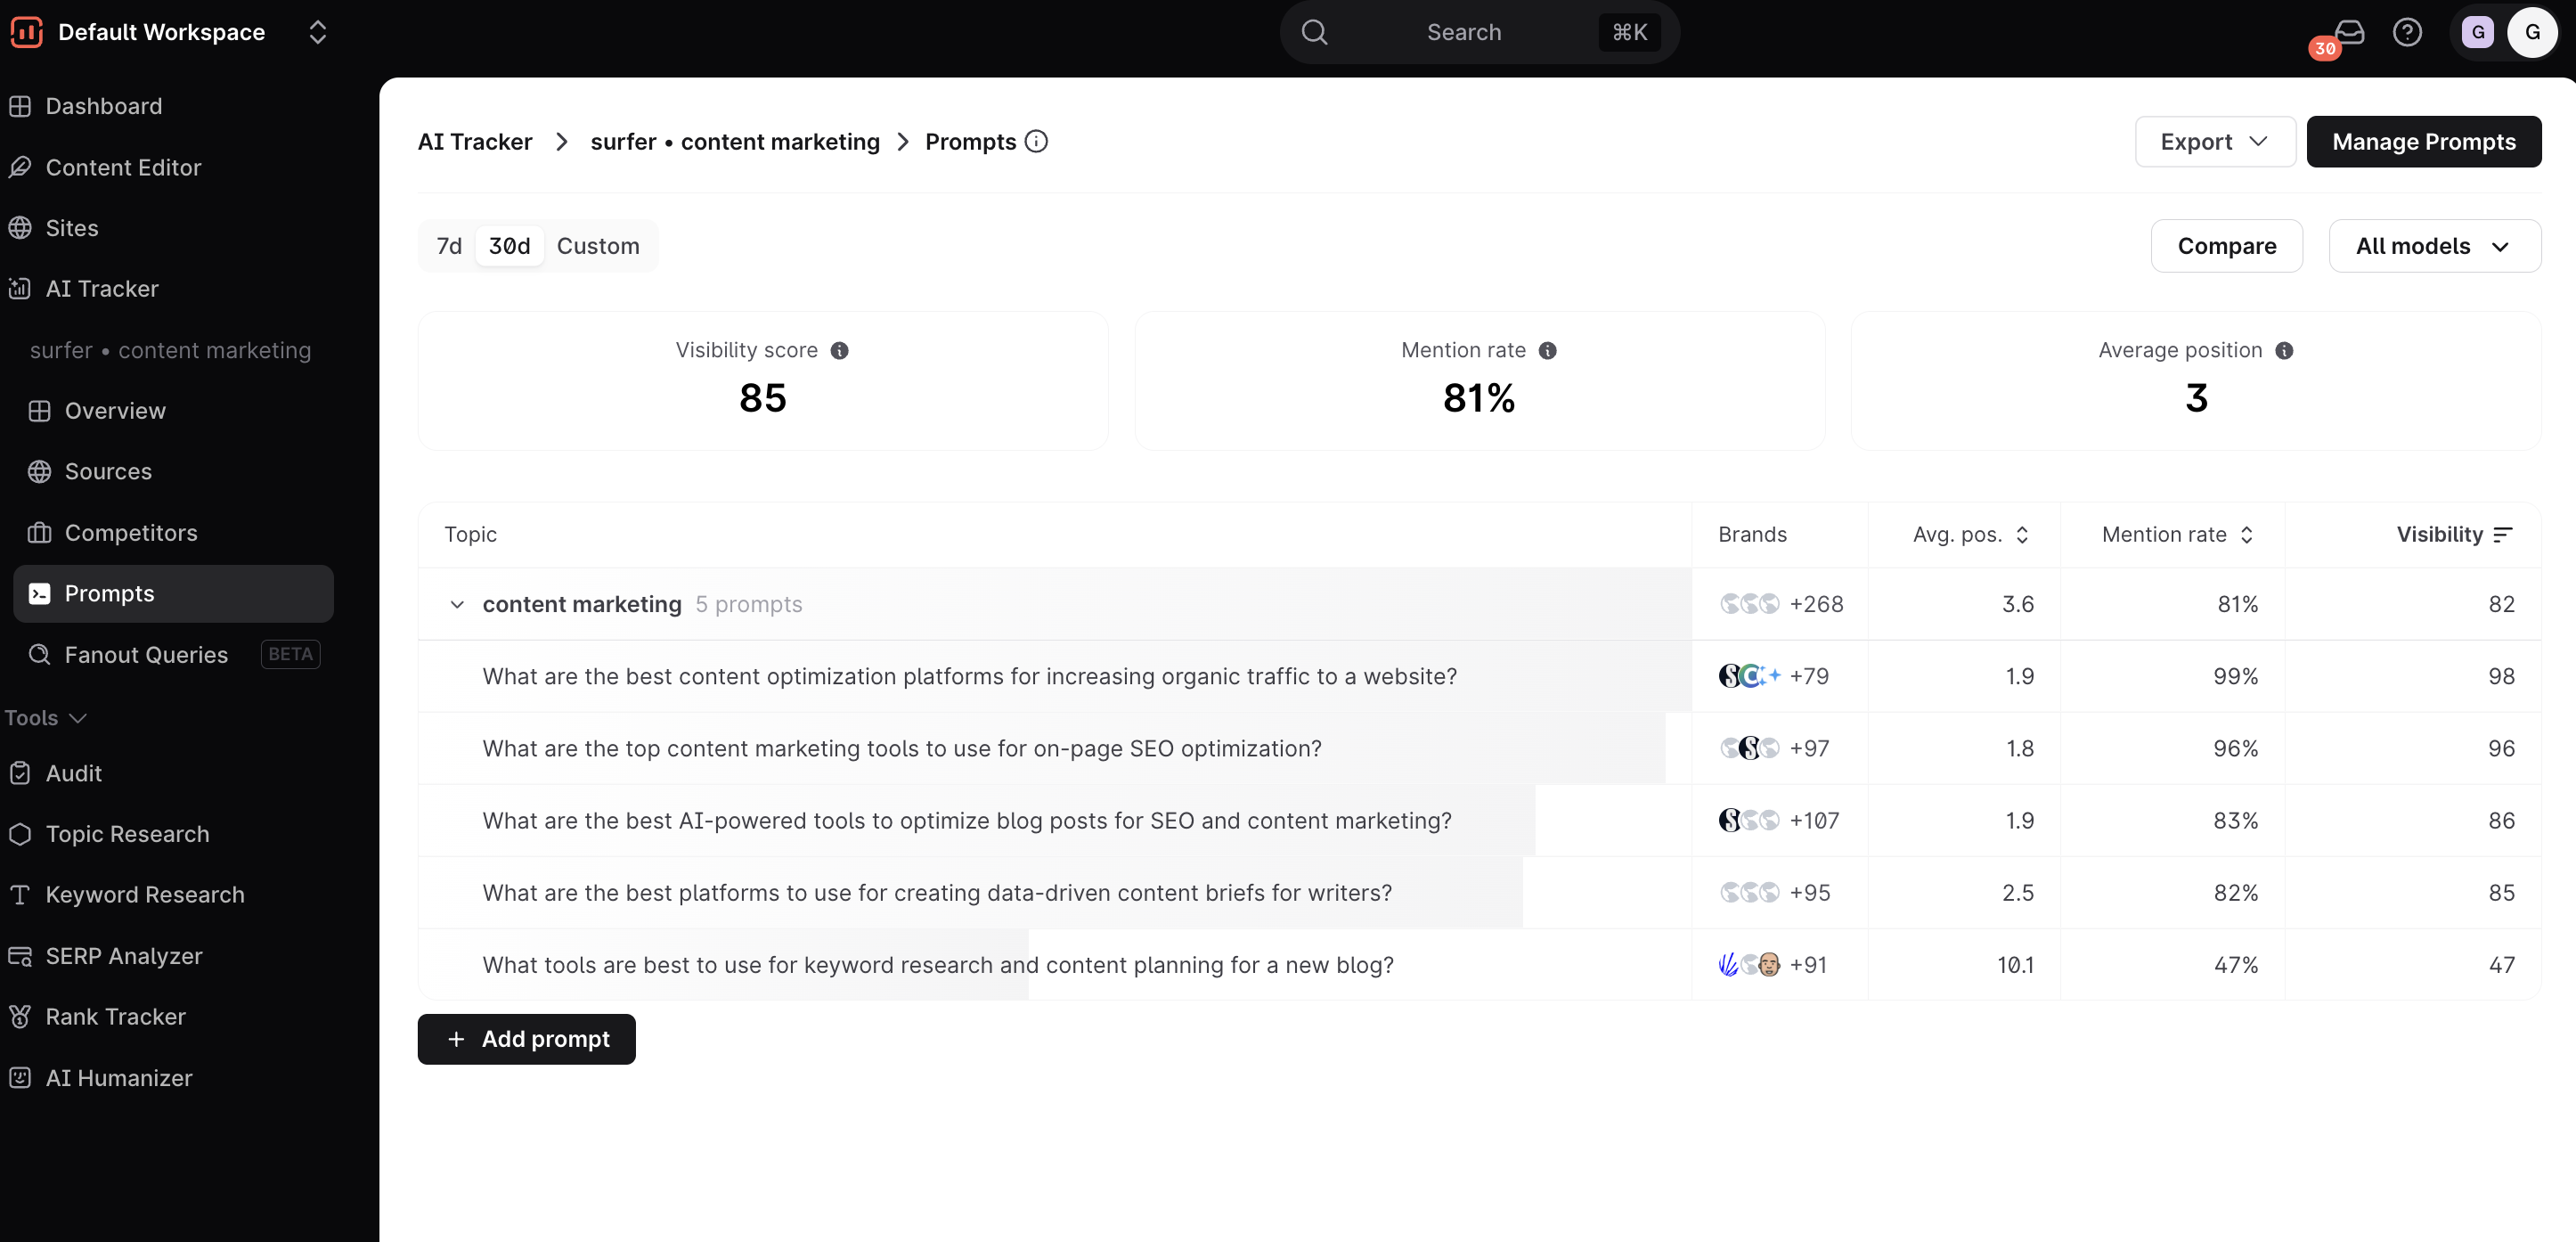
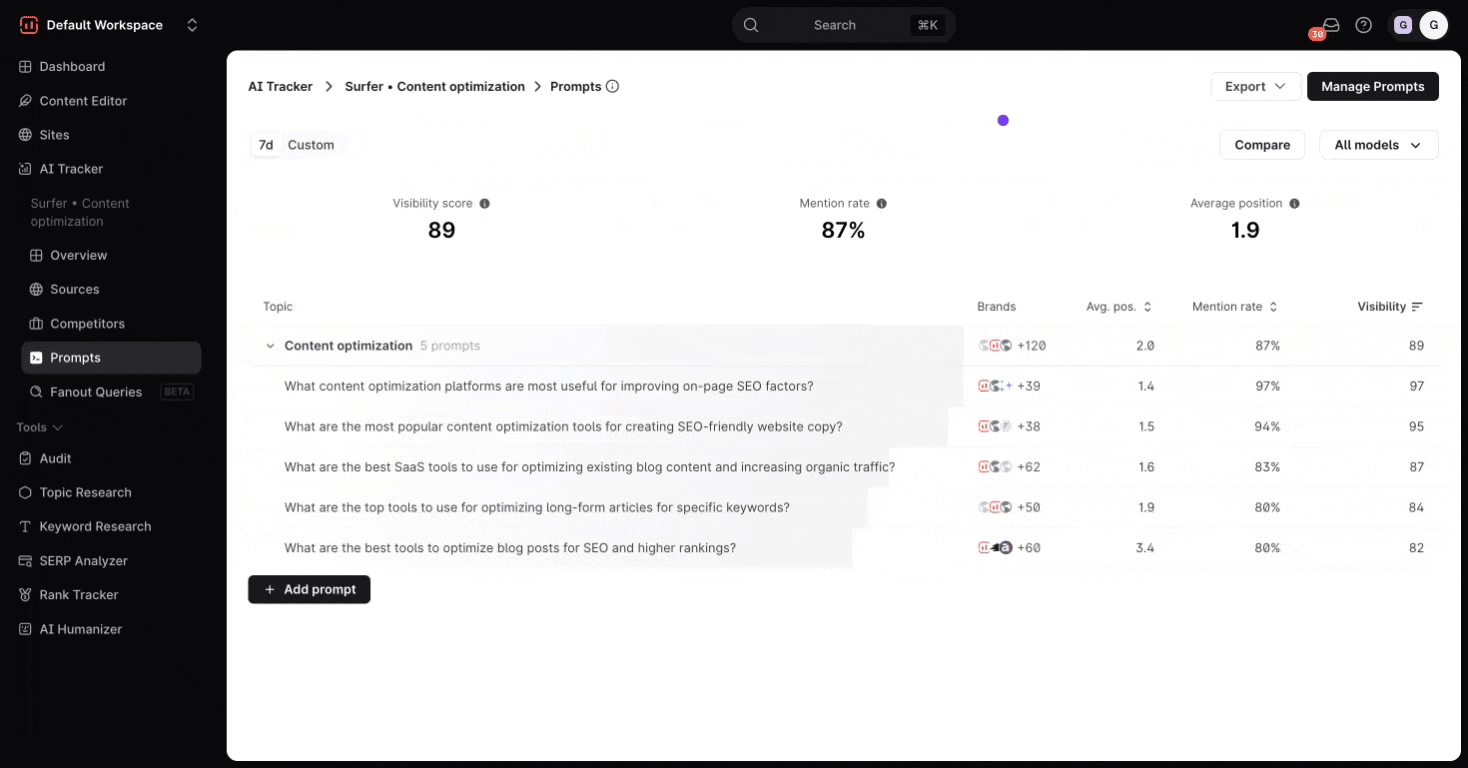
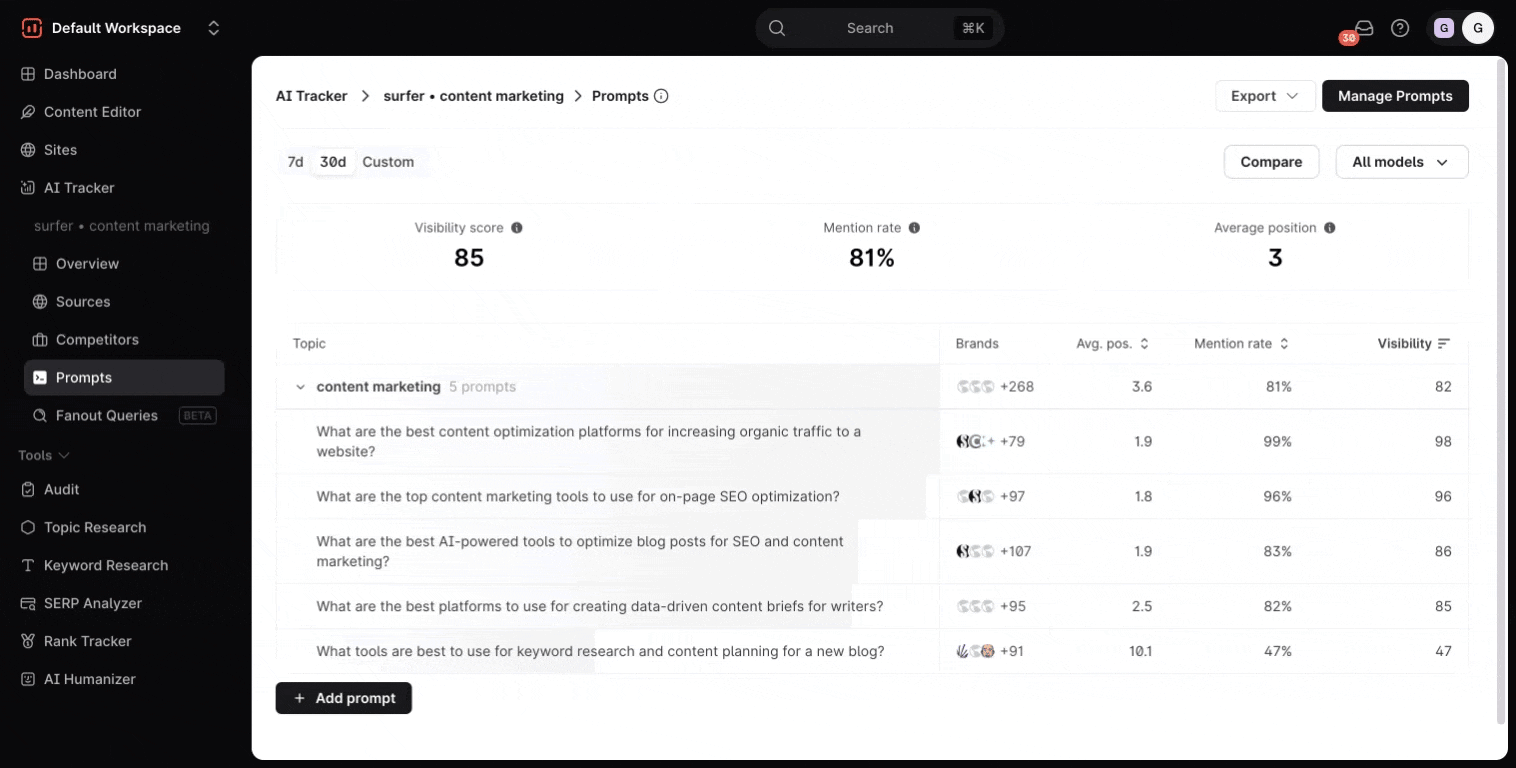
Date range and AI models filters
At the top of the dashboard, you'll find the date range and AI models filters. This lets you select the date range for which you want to show the data and to narrow down results by the AI model
You can see your performance vs. other brands by selecting “Compare.” The reports will show the data comparison between you and your chosen competitor.
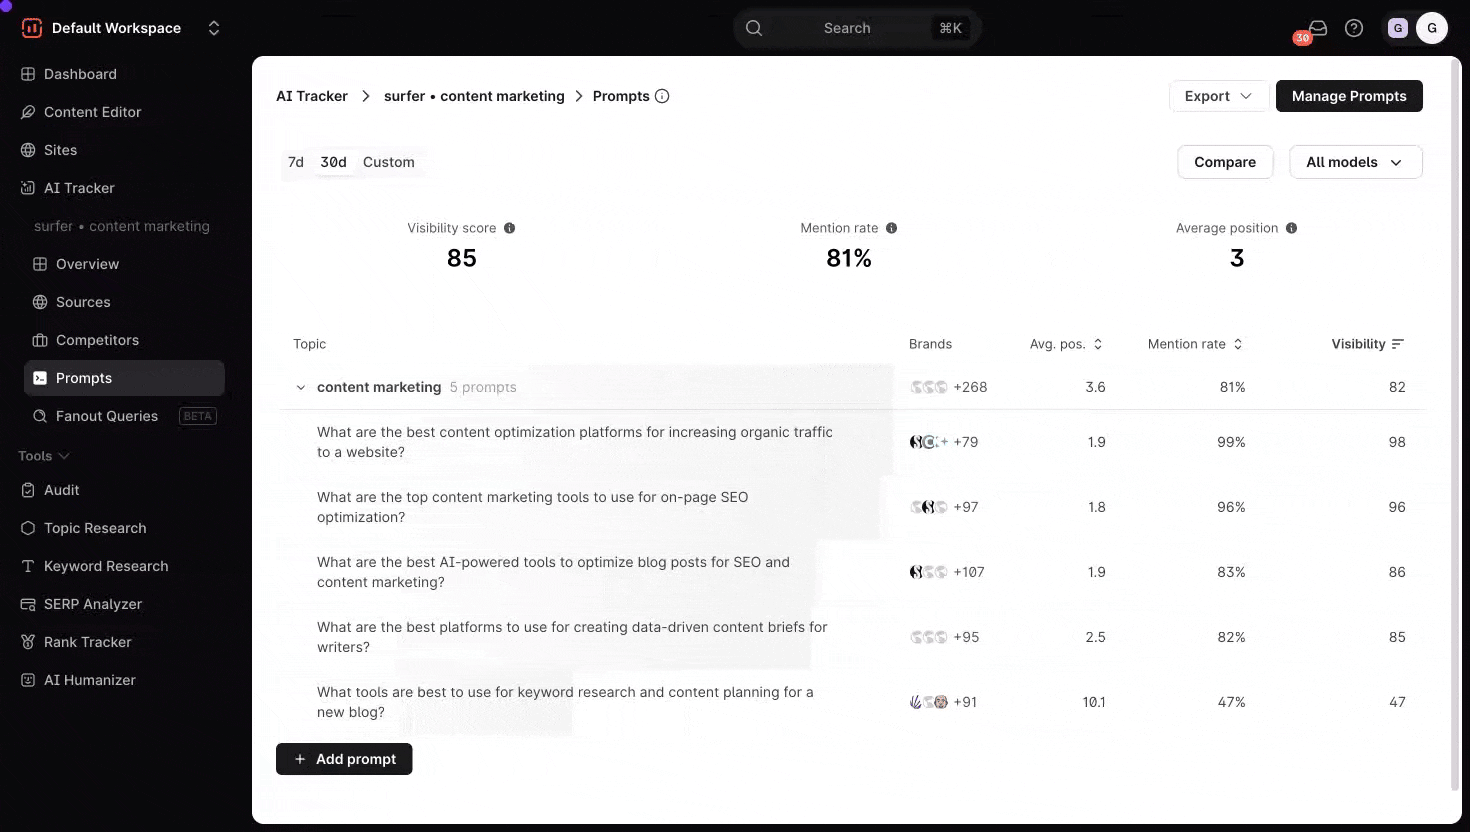
Found on the upper-right corner as a button, you can manage prompts to add, edit, or remove your custom prompts. Unlike when you set up prompts from scratch, here you don’t need to re‑select brand names and/or location info, but the steps to create your prompts remain the same.
You can also add a new topic for the same project and move existing prompts inside it.
Inside your AI Tracker’s Prompts Dashboard, you have four main data results:
Mention Rate: how frequently your brand is mentioned in prompts’ outputs. If those numbers drop, you may need to adjust your prompt strategy.
Visibility Score (aka Presence Score): how often your brand shows up in AI outputs. Monitor how often your brand is visible or mentioned.
Average Position: the typical ranking or order in which your brand appears in AI‑generated content.
Topics Table: Below these key metrics, you will find a table where we present your selected prompts for your chosen topic or keyword and show you the report with the three metrics above. We also added a Brands column which shows which brands are most often recognized by your AI prompts, and how they stack up by average position. This way, you can assess your competitive standing.
From the table, hover over one of your prompts and choose Open details that should appear next to it so you can see a more in‑depth data. Inside, you’ll see:
Detailed graphic table of Visibility Score, Mention Rate, and Average Position over a period of time
Detailed Brands information, such as which LLMs recognize which brand and how they compare in average position.
Fanout Queries table, that presents search queries that AI models generated when answering the selected prompt
Sources table, which references sources mentioned for each brand, sorted (by default) by how many times they appear.
You can review the in-depth details of your prompts without having to close the side panel and switch between prompts by simply clicking on the up and down arrow buttons on the top-left section of the side panel.
You can download the analysis as a .CSV format by clicking the Export button found on the top right corner of the dashboard.