The Sites Dashboard is your real-time control panel for understanding how your website is performing in Google Search. Connected directly with Google Search Console (GSC), the dashboard offers a clean visual summary of your visibility, traffic, and ranking progress, all in one place.
Whether you're monitoring growth, tracking campaign results, or spotting drops in visibility, this dashboard is your go-to.
You can use it to:
Track daily search visibility changes
Set and monitor SEO performance goals
Identify winning or underperforming content
Uncover content optimization opportunities
By understanding the patterns in your data (solid vs dotted lines, traffic goals, keyword positions), you’ll be better equipped to drive meaningful results.
On the top section of your dashboard, you’ll see a smart preview of Optimization suggestions and Content Ideas under the Recommendations tab, including keyword improvements, content opportunities, keyword relevance and difficulty, etc., to help you identify what topics to cover next.
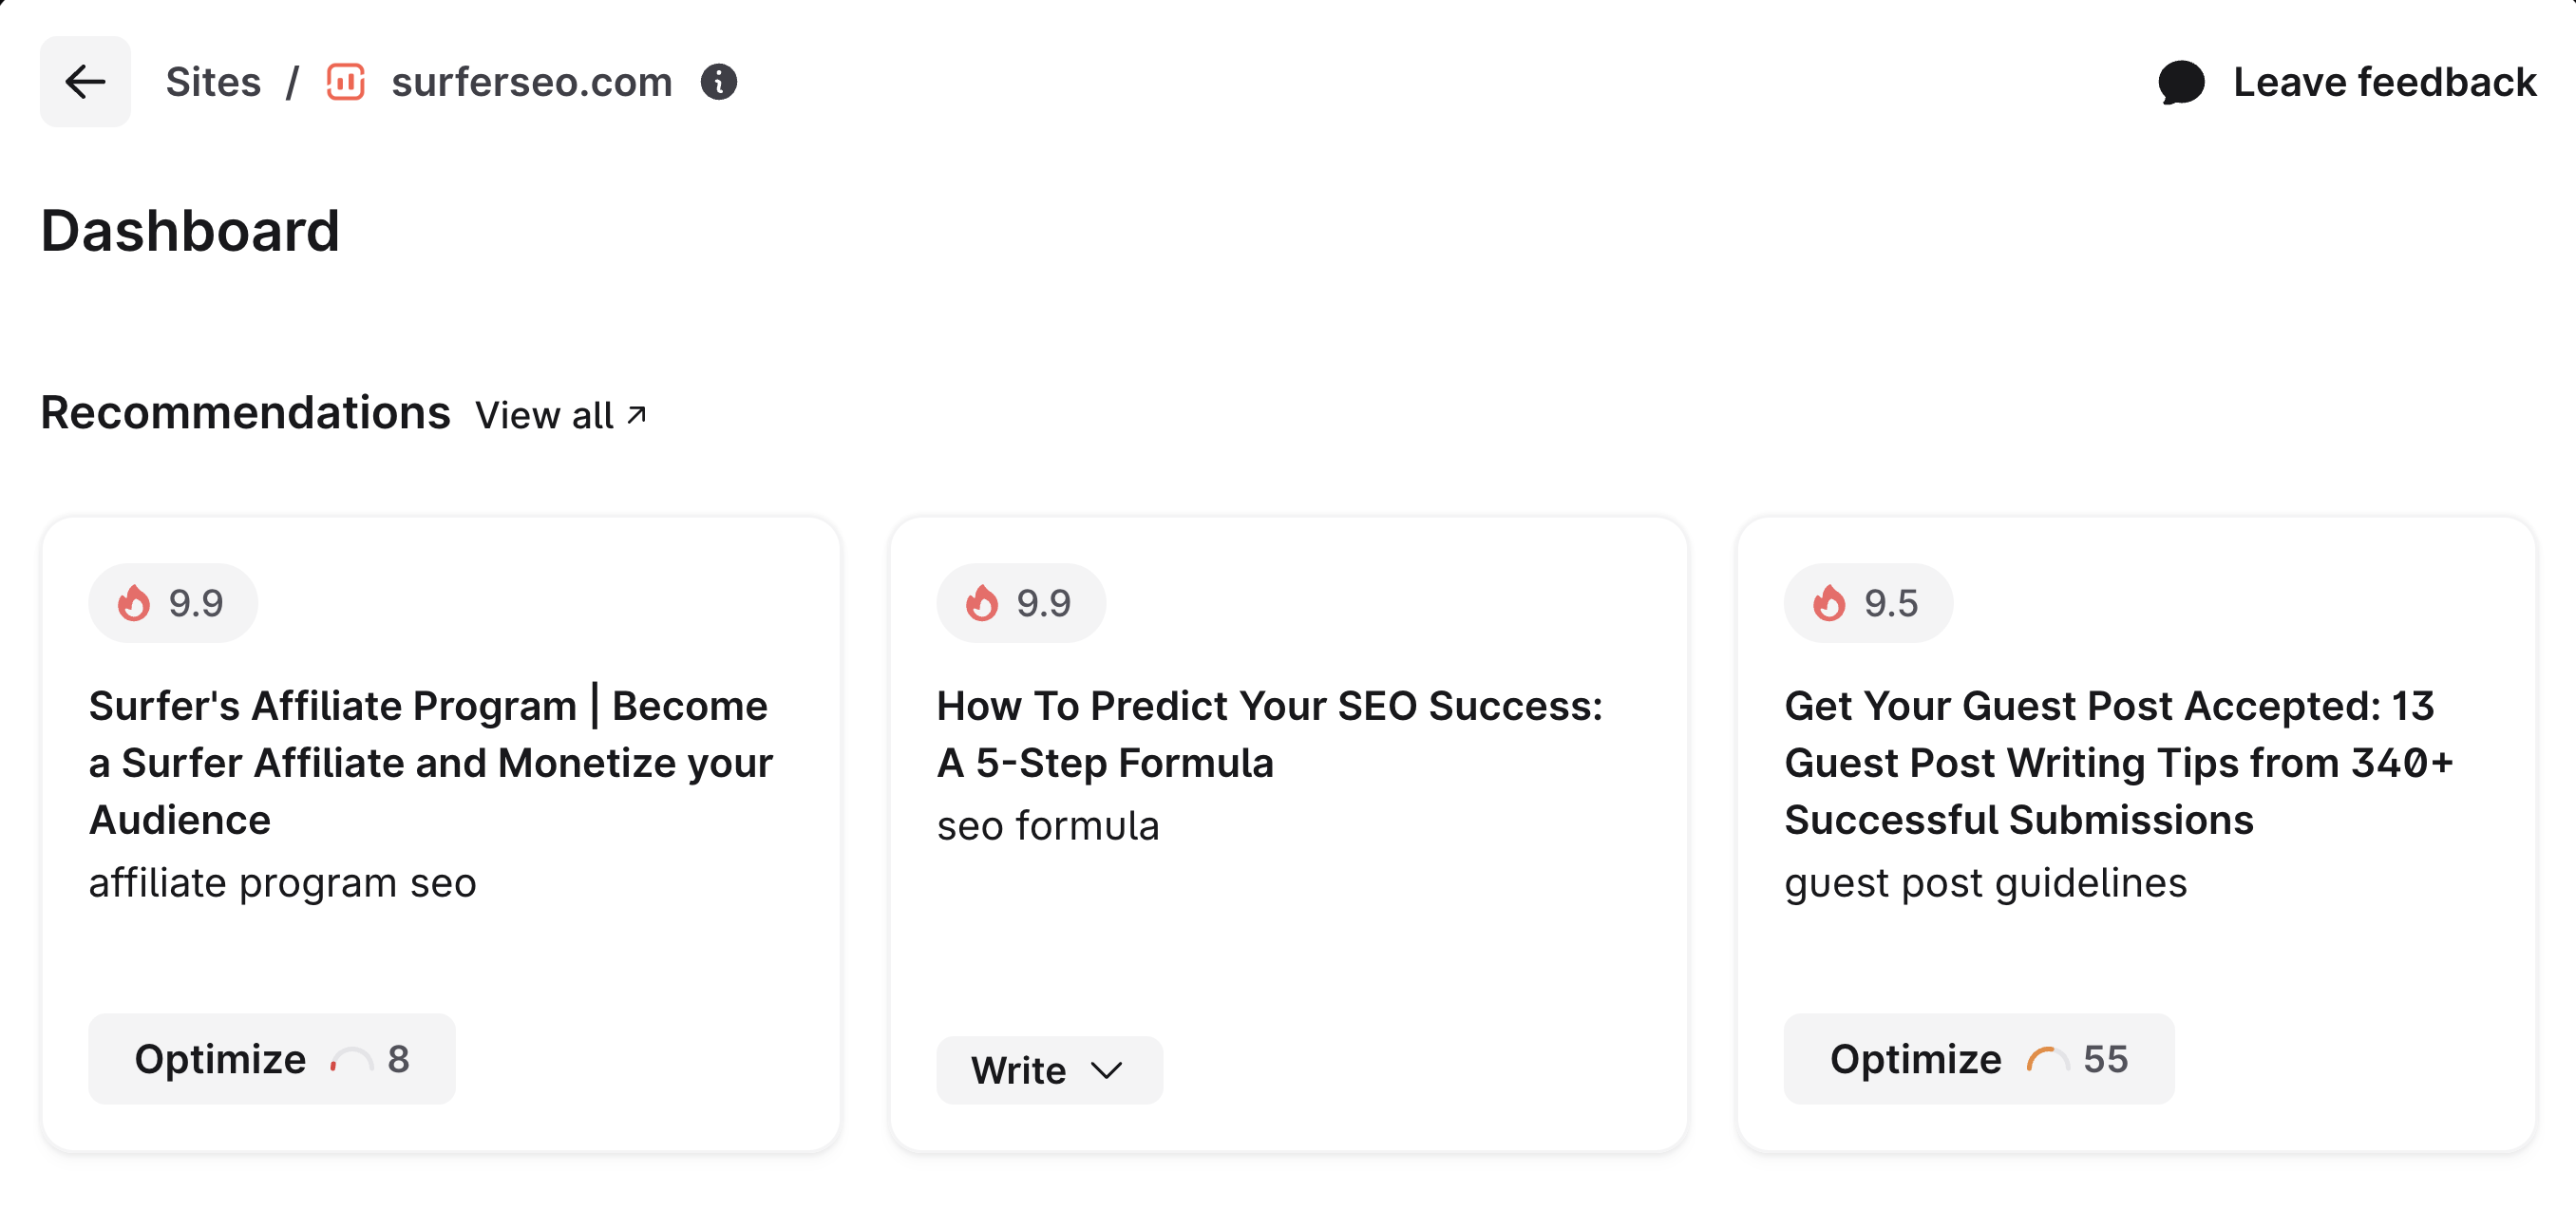
After clicking one of the recommendations, you'll get redirected to the main view of the Recommendations dashboard. Each idea or recommendation comes with supporting data, such as:
Keyword Difficulty (KD)
Search Volume (SV)
How many of your competitors already cover the topic
Content Score
... and many more
Clicking one of the titles shown in the smart preview will redirect you to either the full analysis of Content Audit or Topical Map for the respective recommendation.
While you will get a mix of both Content Audit and Topical Map recommendations, this is by design, as the recommendations are arranged based on the score. This way, you can addressed the lowest hanging fruit first. 🚀
At the top of your dashboard is your Performance Chart, where you'll see a line graph tracking four key metrics:
Clicks (Blue line): How many users clicked through your site from Google
Impressions (Purple line): How often your pages appeared in search results
Average CTR (Green line): How often users click your listing when they see it
Average Position (Orange line): The average ranking of your website's link in the search results for a given query over a period of time
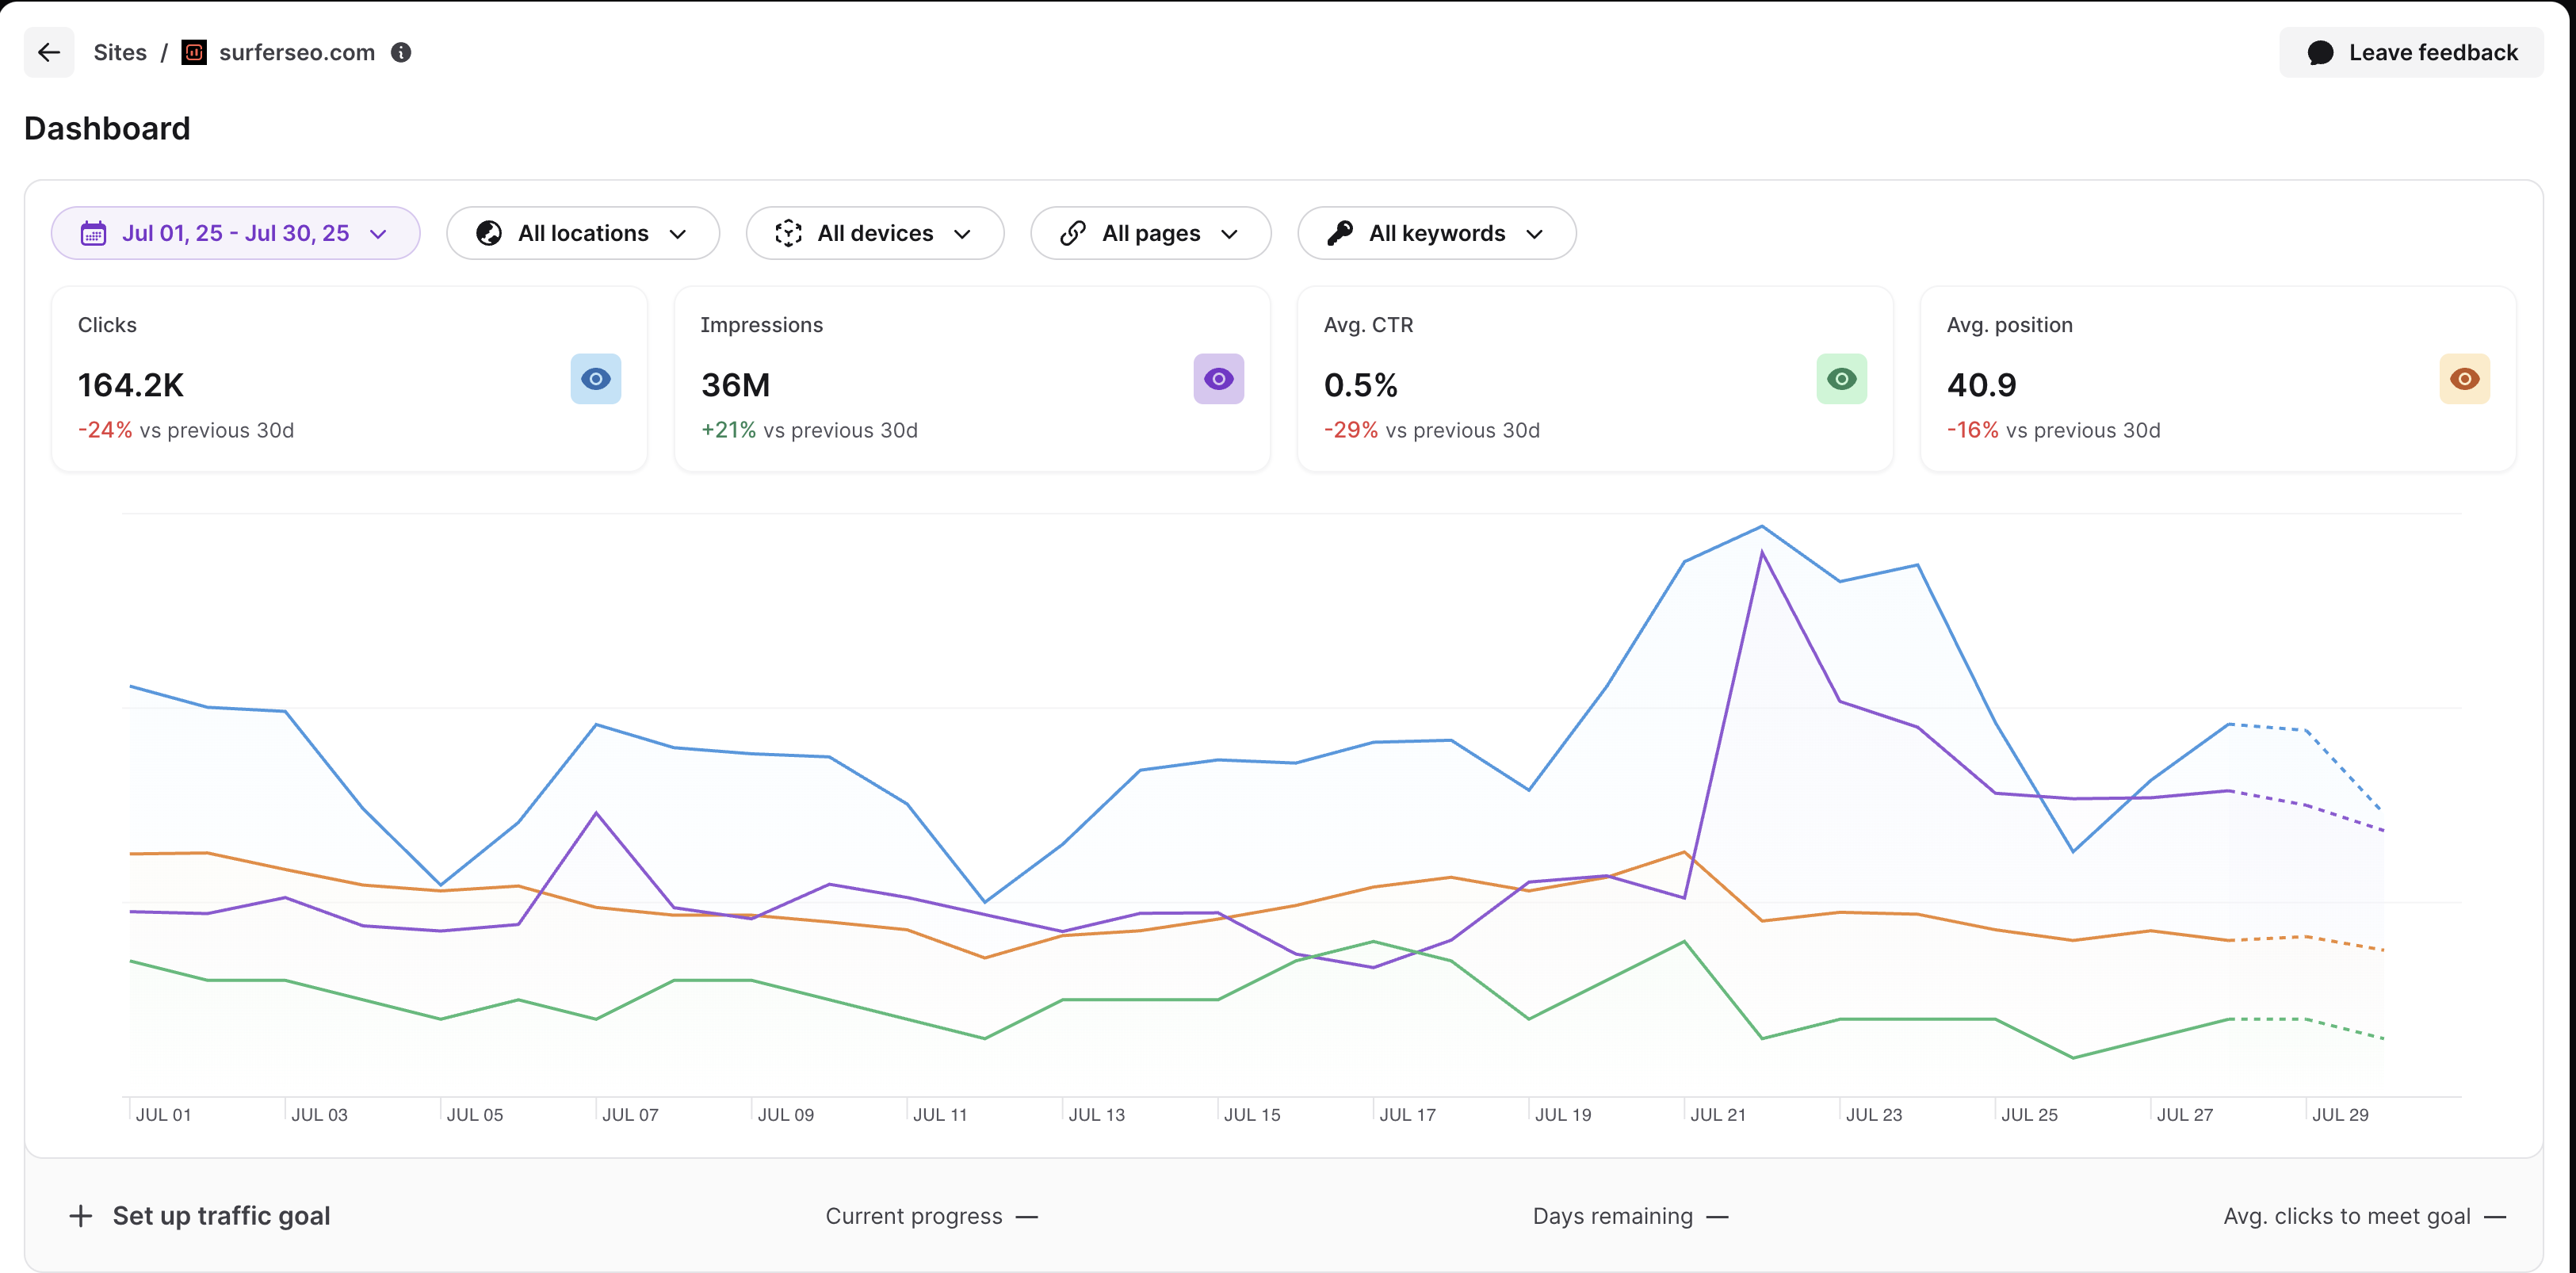
You'll notice that the line graph won't completely show a solid line. This is because we're mirroring your page performance from Google Search Console.
Solid lines indicate the complete or final data from GSC. This is already processed by Google, and usually has a delay of about two to three days.
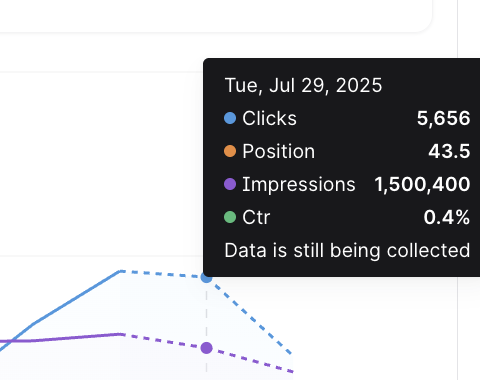
Dotted lines indicate the fresh or current data. These are basically early signals, but they may still change once the final numbers come in. If you hover your cursor above it, it'll indicate that the Data is still being collected, as seen below.
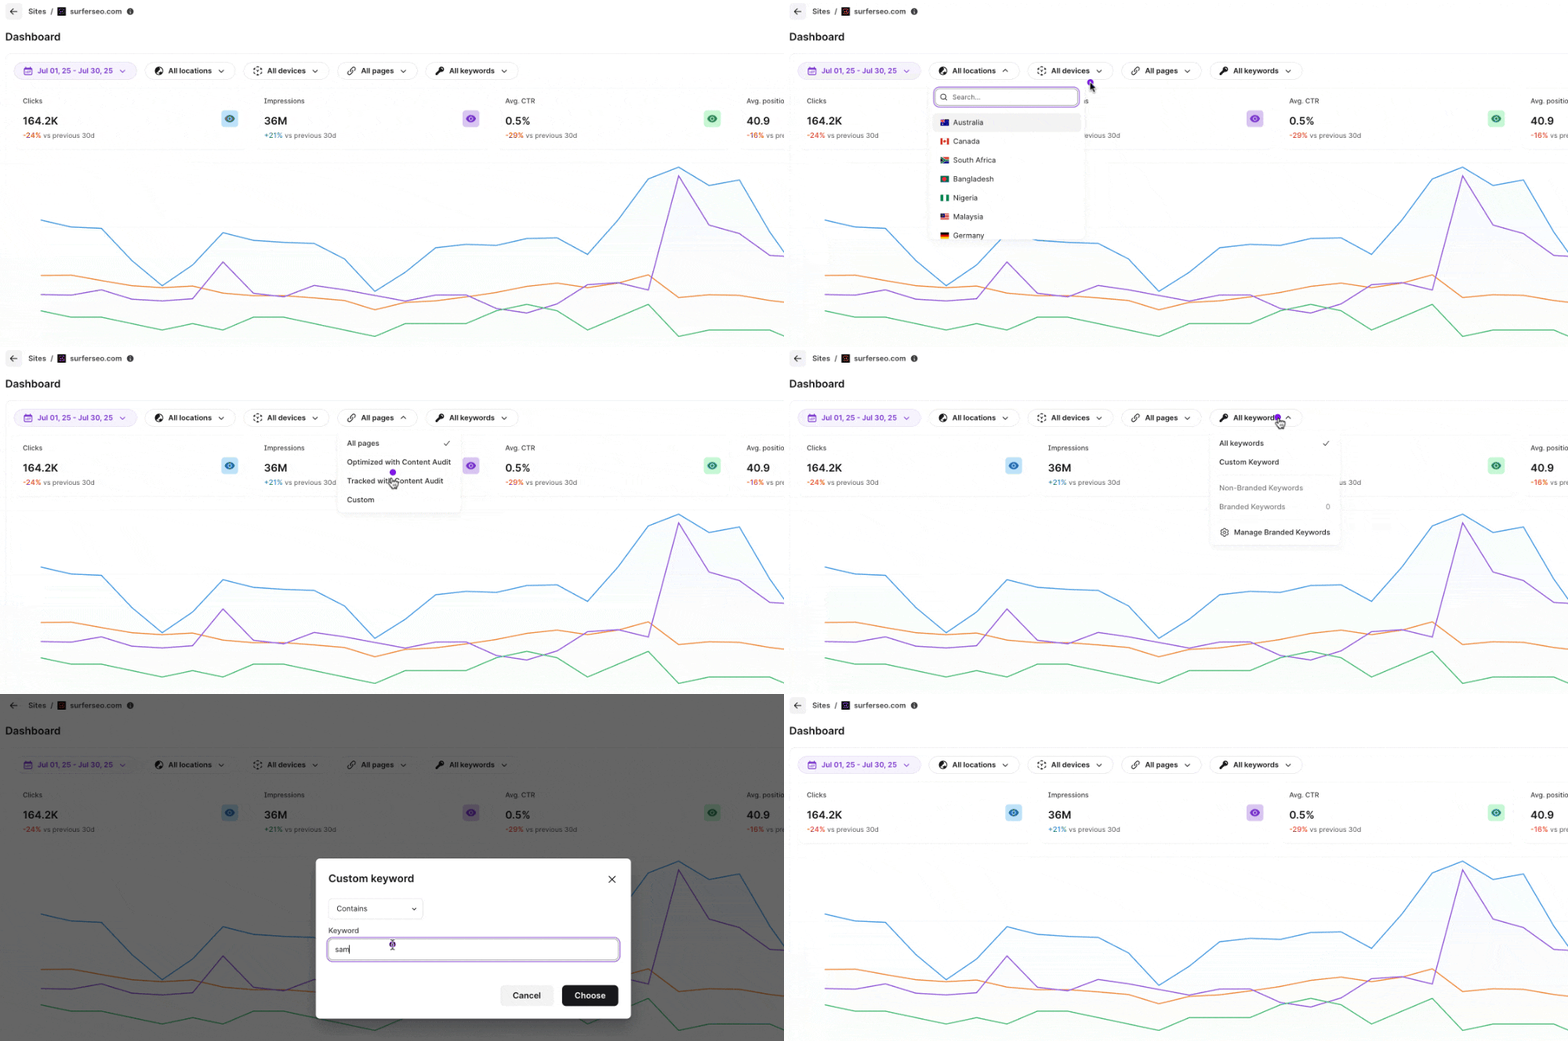
You can filter the report by:
Date period
Locations
Device Type
Desktop
Mobile
Tablet
Pages
All pages
Pages optimized with Content Audit
Pages you are tracking with Content Audit, but haven't actioned
Custom
Keywords
All keywords
Custom Keyword
Branded or Non-Branded Keywords
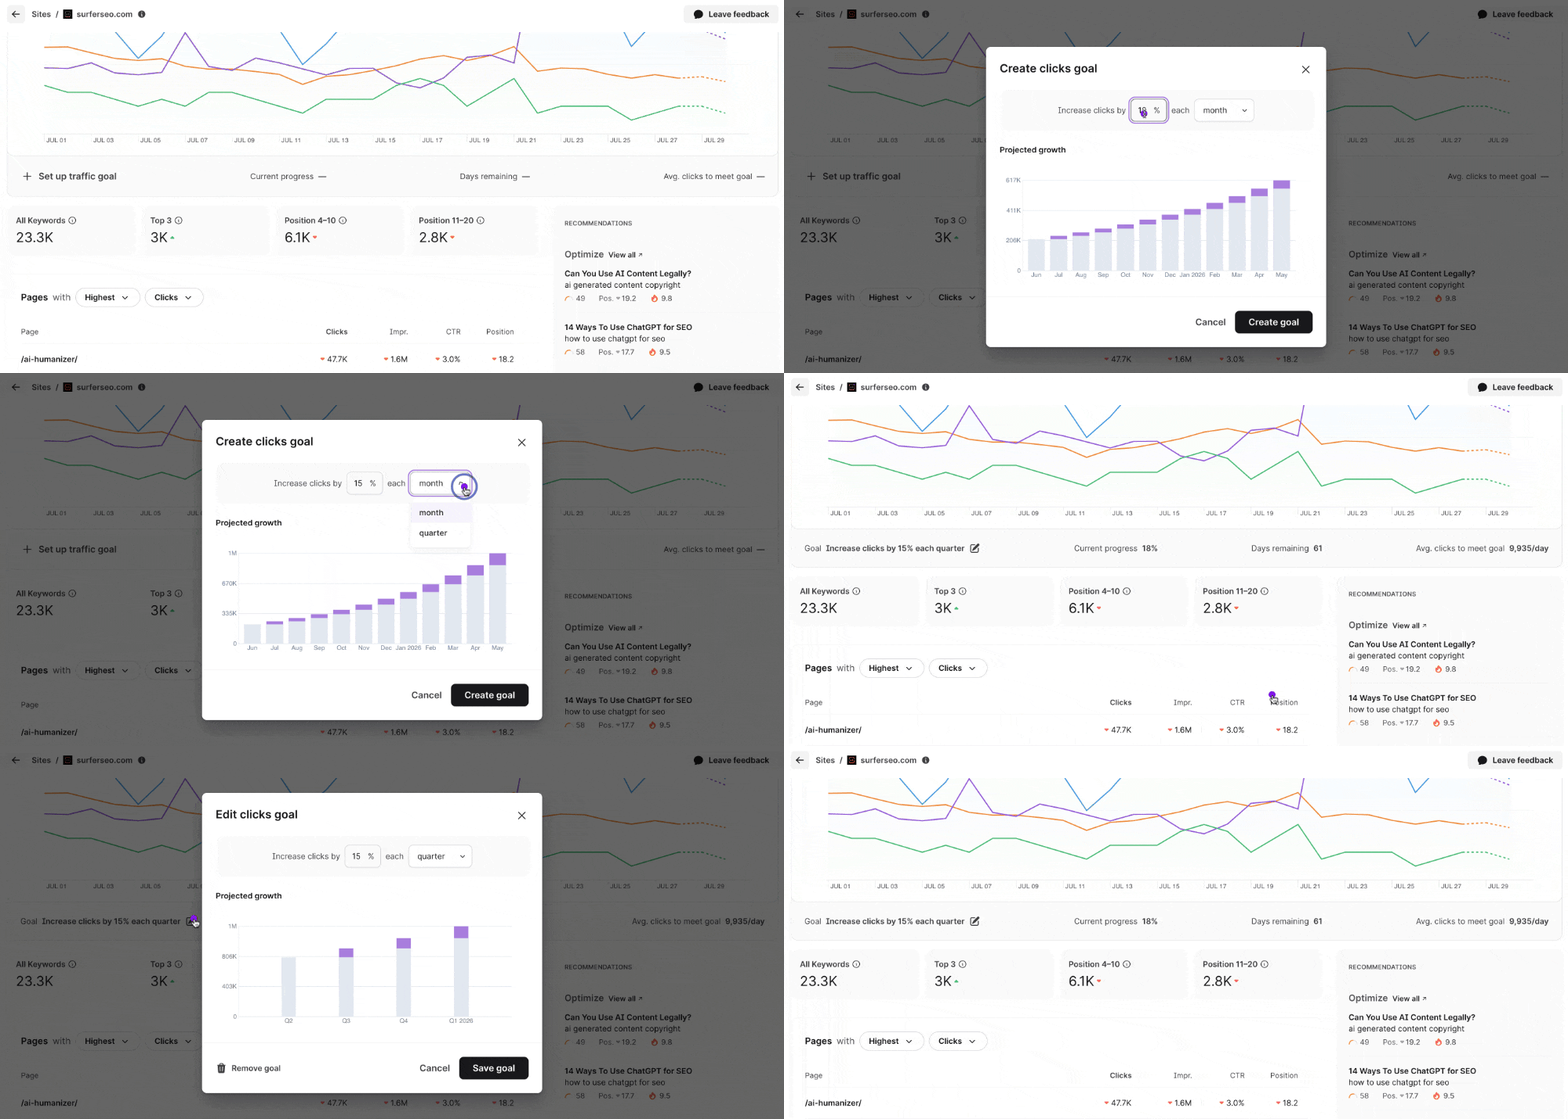
Below the performance chart, you can set specific goals to help track your growth over time. This allows you to define success clearly and track progress automatically.
Click Set up traffic goal, and you’ll be able to:
Choose a time range (Monthly or Quarterly)
Set a click percentage increase as your target
Once a goal is set, you’ll see:
Current progress: A visual indicator showing how far along you are toward your target
Days remaining: Time left to meet the goal
Average clicks to meet goal: A calculated daily average you need to stay on track
This section breaks down your keyword distribution across different ranking groups:
Metric | What does it mean? |
All Keywords | This would be the total number of keywords your content is targeting |
Top 3 | Keywords for which your page ranks in positions 1-3 |
Position 4-10 | Keywords ranking in positions 4-10 |
Position 11-20 | Keywords ranking in positions 11-20 |
These ranges are valuable for identifying high-performing content and low-hanging fruit that could be optimized for better visibility.

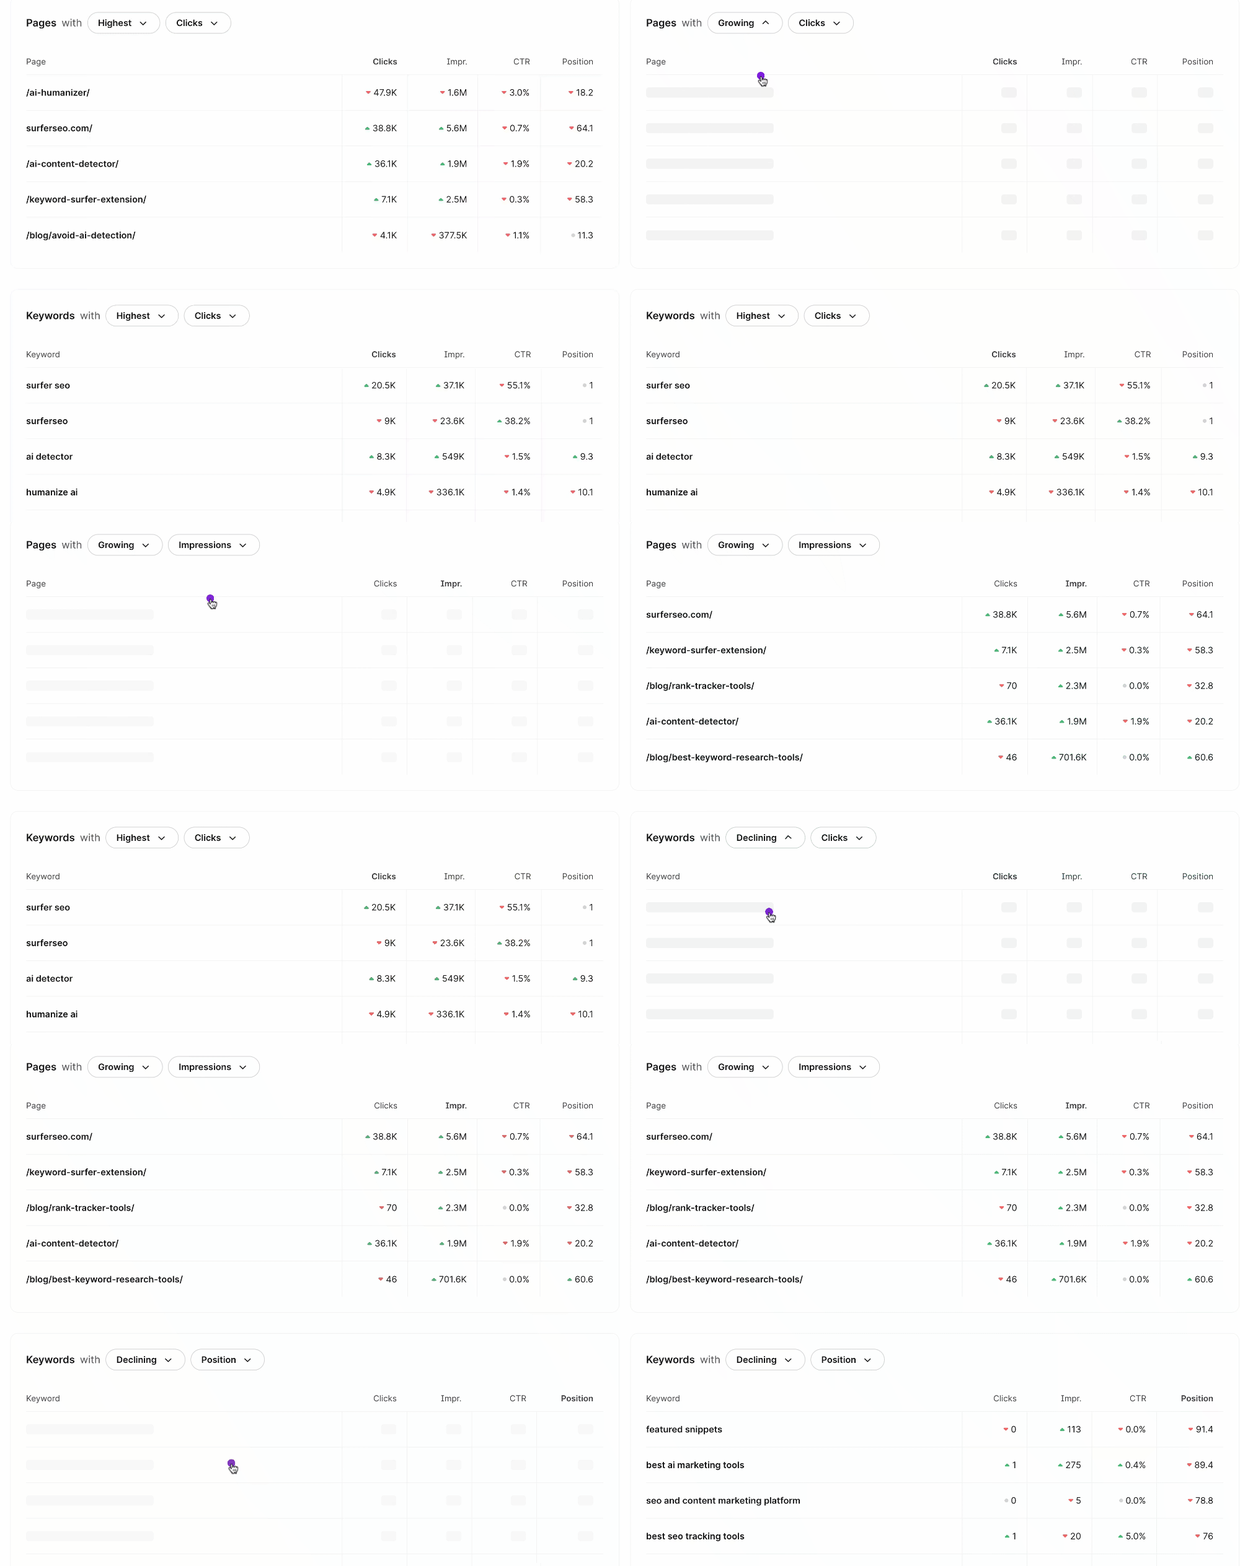
Further down the dashboard, you can choose to analyze your performance either by Page or by Keyword.
Each section has an identical set of filters. You can sort it out using the following sets:
Highest, Growing, Declining
Clicks, Impressions, CTR, Position
This makes it easy to pinpoint:
Which content drives the most traffic
What pages or keywords are on the rise or slipping
Where you're missing CTR opportunities
For instance, a page like /ai-humanizer/ may have lost 47.7K clicks, while /ai-content-detector/ gained 36K, signaling a change in user behavior or search demand.
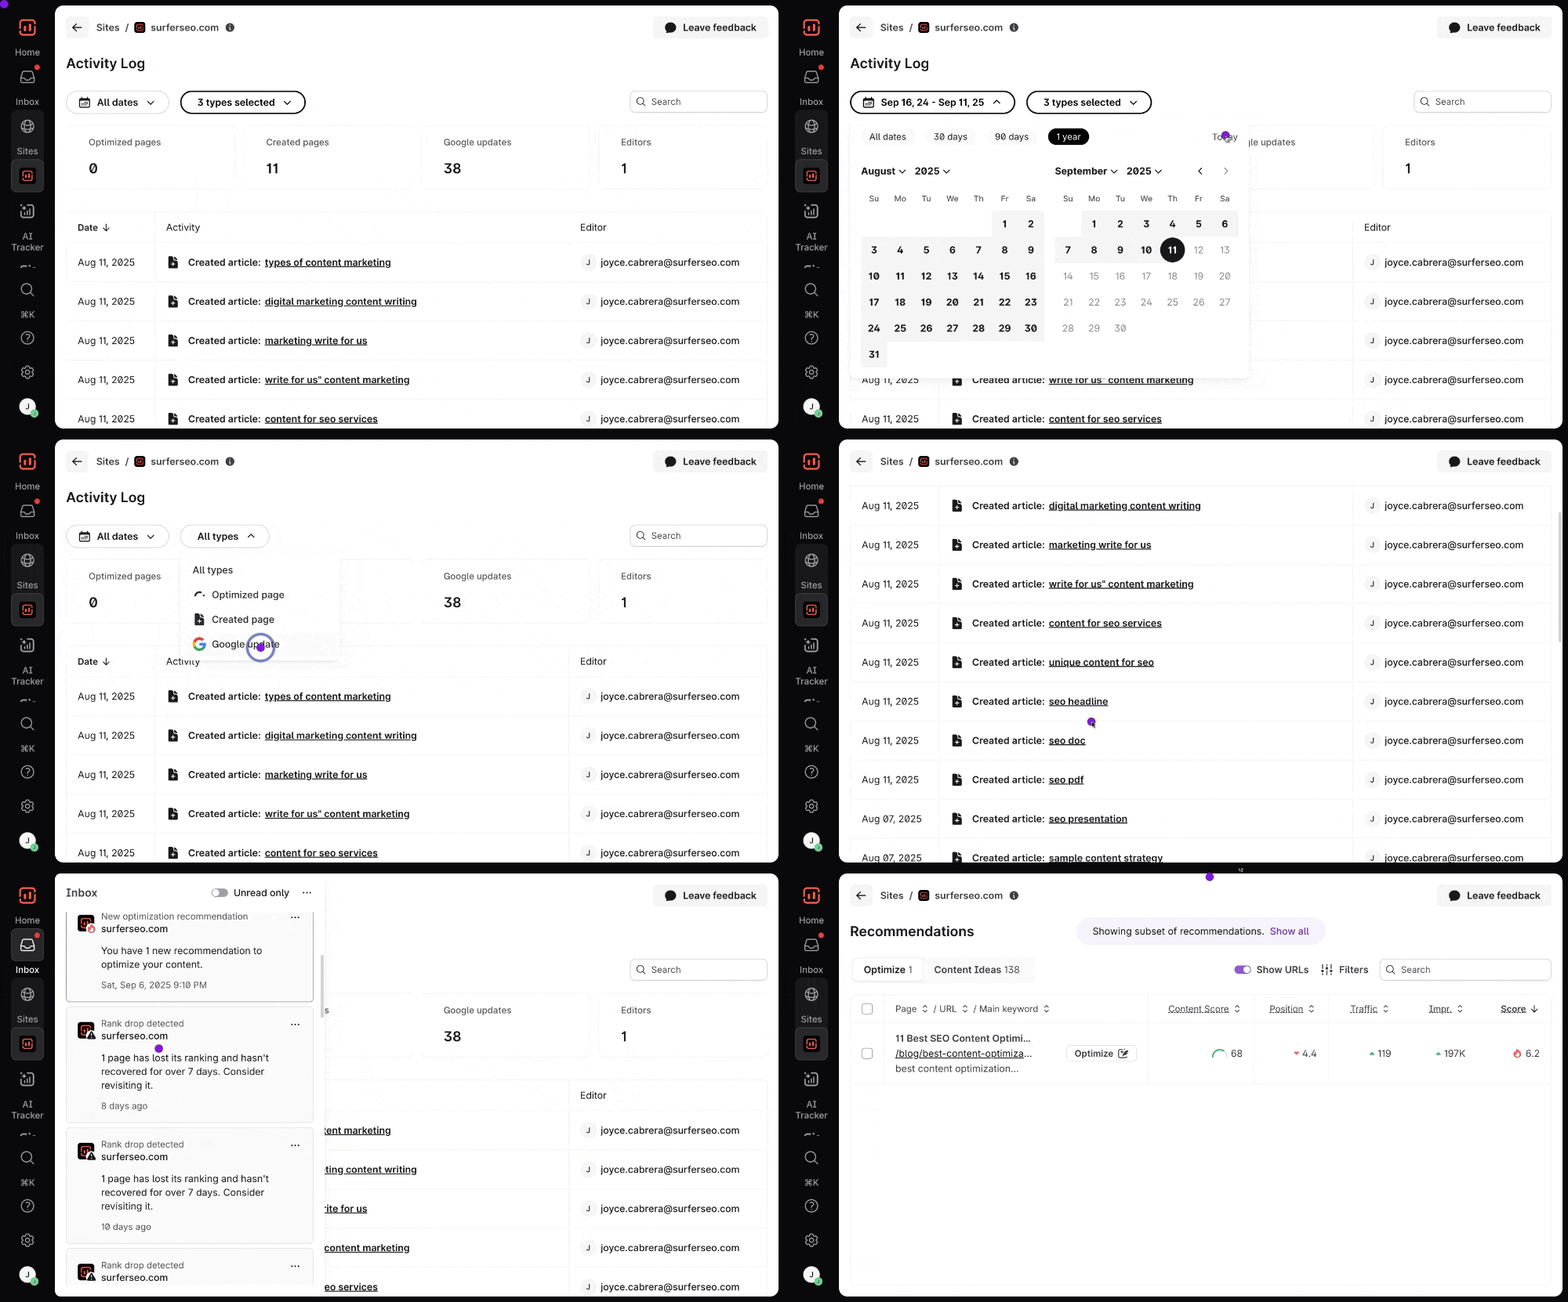
The last selection under Sites would be your Activity Log.
This is where you'll find actioned items, which you can filter by dates, optimized pages, newly created pages, and Google updates.
On the farthest right portion of the screen, you'll also see who in your organization initiated the changes.
While in the Inbox section, you'll find your Notifications.
This is where you'll find notices of actionable recommendations, such as rank drop alerts and new optimization suggestions.
💭 Do you still need help? You can reach us at [email protected] or by clicking on the chat icon in the bottom-right corner. We're here 24/5! 😊